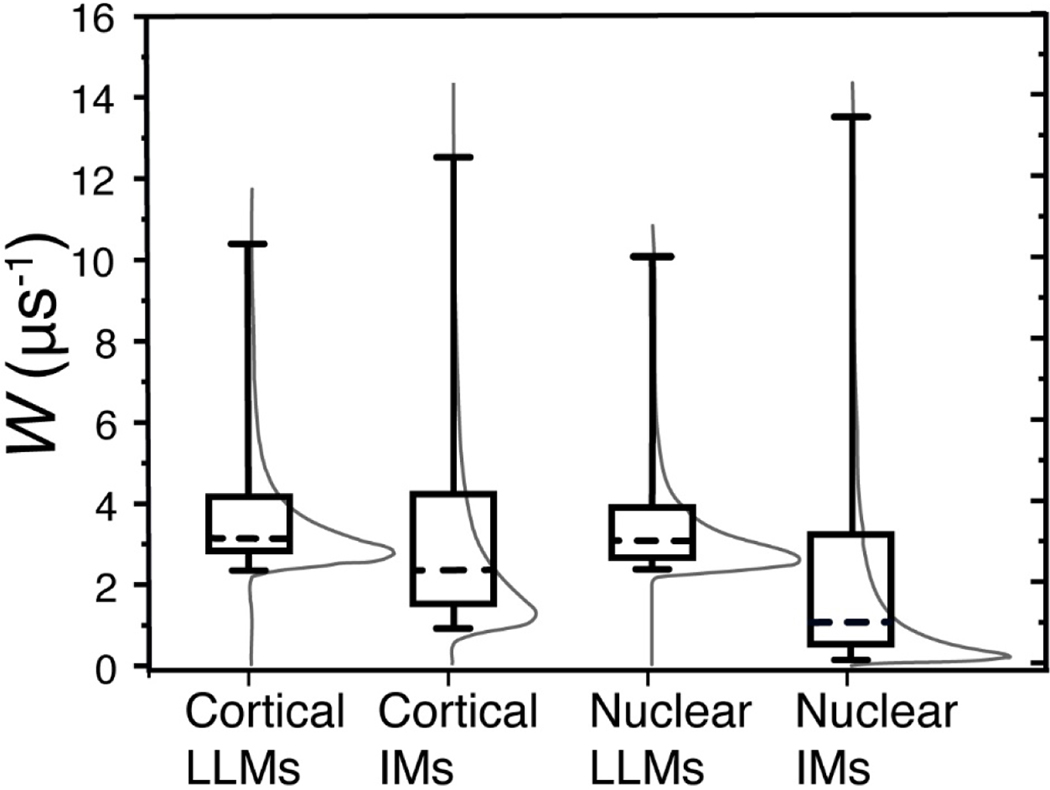
Fig. 4.
The distributions of Ws in cortical and nuclear IMs and in the LLMs associated with them, they are indicated by thin gray lines. The whiskers (cumulative probability distributions) extend from the 5th to 95th percentile of all possible collision rates in a given sample. The boxes extend from the 25th to 75th percentiles, and the dashed lines represent the 50th percentiles of cumulative probability distributions.

