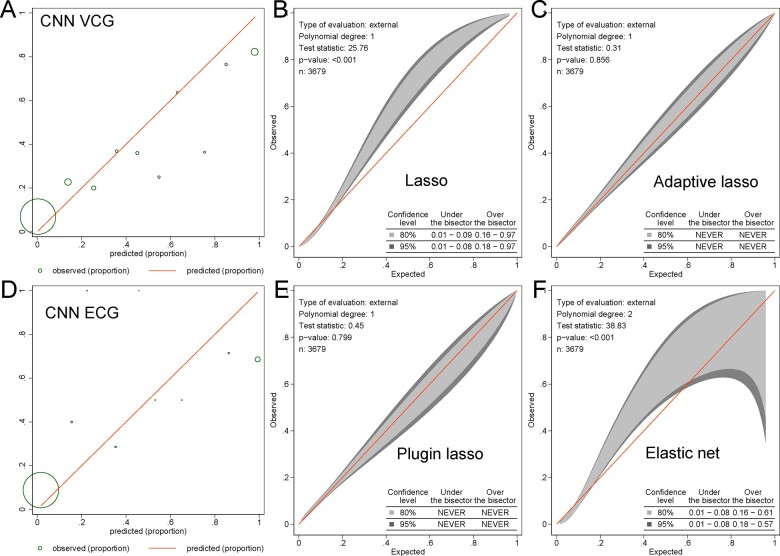
Figure 5.
Calibration of electrocardiogram and vectorcardiographic models. The calibration plot shows the observed and predicted cardiovascular disease proportions in the (A) convolutional neural network model with vectorcardiographic input (43 variables) and (D) electrocardiogram input (153 variables). The size of the circles is proportional to the amount of data. The calibration belt with 80% and 95% confidence intervals on the external sample shows the observed and predicted cardiovascular disease proportions in (B) lasso, (C) adaptive lasso, (E) plugin lasso, (F) elastic net models with electrocardiogram and vectorcardiographic input (695 predictors).

