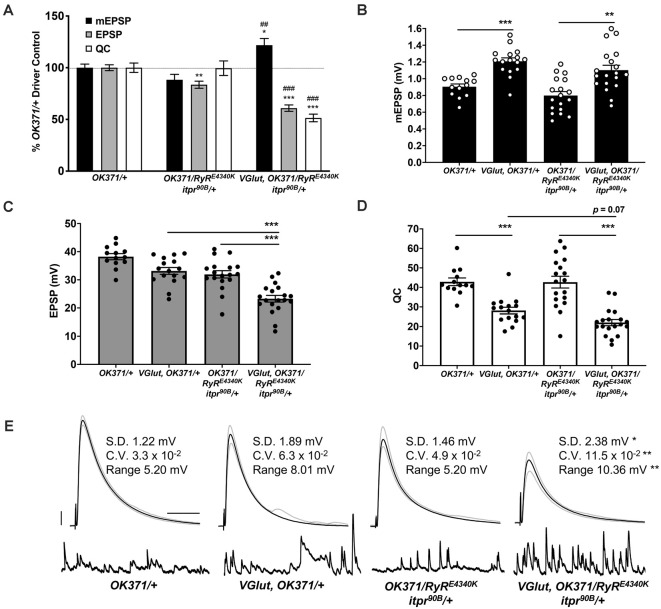
Figure 3.
Double heterozygous loss of the itpr and RyR genes interacts with the PHD challenge to diminish neurotransmission. Note: traces and data for OK371/+ and VGlut, OK371/+ are repeated from Figure 1; for genetic background comparison. Abbreviations are as in Figure 1. (A) NMJ electrophysiological data for mEPSP, EPSP, and QC. Data are normalized to OK371/+ values. *p < 0.05, **p < 0.01, and ***p < 0.001 vs. OK371/+; ##p < 0.01 and ###p < 0.001 vs. OK371/RyRE4340K; itpr90 B/+; analyses by one-way ANOVA with Tukeys post-hoc. (B) Raw data for mEPSPs. (C) Raw data for EPSPs. (D) Raw data for QC. For (BD), bars are averages and error bars are SEM. *p < 0.05, **p < 0.01, and ***p < 0.001 by one-way ANOVA across genotypes, with Tukeys post-hoc. (E) Representative electrophysiological traces with standard deviation (SD), coefficient of variation (CV) and range values for EPSPs. The SD, CV, and range were significantly higher for VGlut, OK371/RyRE4340K; itpr90B/+ vs. its genetic control, OK371/RyRE4340K; itpr90B/+. *p < 0.05, **p < 0.01 by one-way ANOVA across genotypes, with Tukeys post-hoc. Scale bars as in Figure 1.

