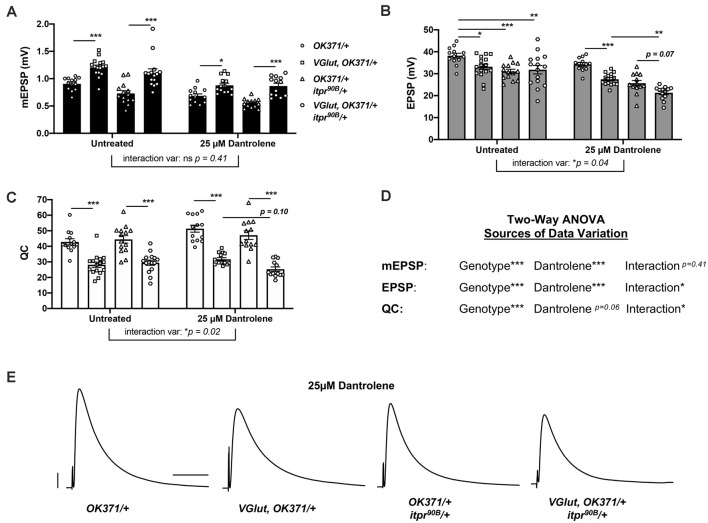
Figure 5.
Genetic impairment of itpr combined with pharmacological impairment of RyR phenocopies genetic findings. Notes: Untreated data for OK371/+ and VGlut, OK371/+ are repeated from Figure 1; for genetic background comparison, and analyses are by two-way ANOVA with Tukeys post-hoc to account for genotype effects, 25 M Dantrolene effects, and interaction effects between genotype and Dantrolene. (A) Raw data for mEPSPs. (B) Raw data for EPSPs. (C) Raw data for QC. For (AC), bars are averages and error bars are SEM, with individual datapoint shapes corresponding to genotype. (D) Two-way ANOVA analysis of the effects of each parameter on data variation for each electrophysiological measure. *p < 0.05, **p < 0.01, and ***p < 0.001 by two-way ANOVA with Tukeys post-hoc. (E) Representative EPSP traces. Scale bars are as in Figure 1.

