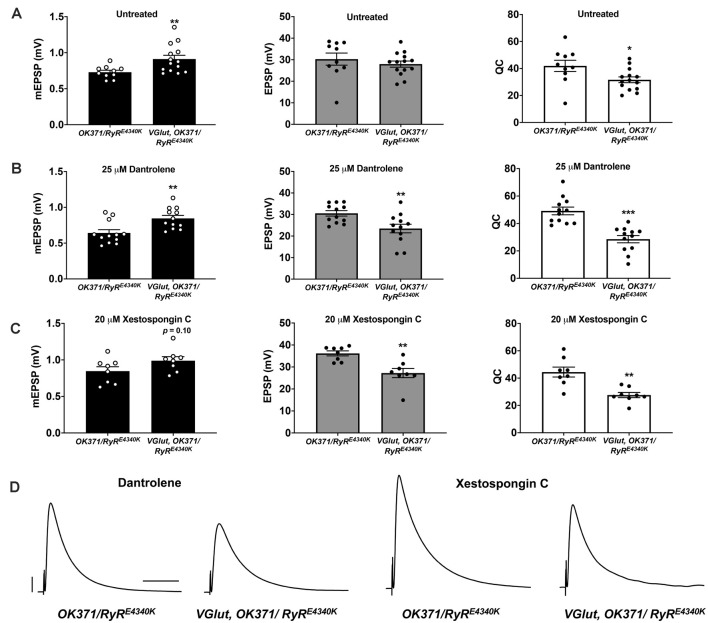
Figure 6.
Additional pharmaco-genetic combinations phenocopy the genetic conditions. (A) Raw data for mEPSPs (left); raw data for EPSPs (middle); raw data for QC (right) for untreated genotypes as shown; bars are averages and error bars are SEM. (B) Data as in (A) but with 25 M Dantrolene added to NMJ preps. (C) Data as in (A) but with 20 M Xestospongin C added to NMJ preps. (D) Representative EPSP traces. Scale bars are as in Figure 1. *p < 0.05, **p < 0.01, and ***p < 0.001 by Students t-test comparing a control dataset (no VGlut overexpression) vs. an experimental dataset (VGlut overexpression).

