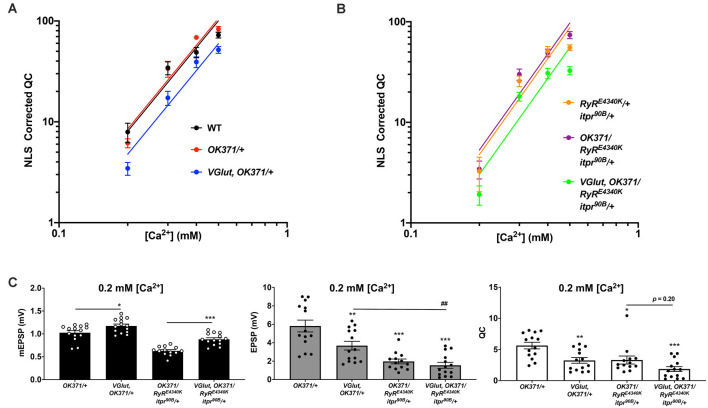
Figure 7.
Ca2+ concentration-sensitivity of PHD execution. (A) log-log plots of recording saline [Ca2+] vs. QC corrected for non-linear summation for WT, OK371/+, and VGlut, OK371/+ conditions. Across the range of [Ca2+] examined, there is no significant difference in calcium cooperativity for these conditions (Nonlinear Regression, p = 0.91). (B) Data plotted as in (A) but this time with a double heterozygous RyRE4340K/+; itpr90B/+ genetic background. Across the range of [Ca2+] examined, there is no significant difference in calcium cooperativity for these conditions (Nonlinear Regression, p = 0.78). (C) Raw data for mEPSPs (left); raw data for EPSPs (middle); raw data for QC (right). All data are for the indicated NMJ genotypes in 0.2 mM [Ca2+]; bars are averages and error bars are SEM. For mEPSPs, *p < 0.05 and ***p < 0.001 by Students t-test, comparing PHD-challenged genotypes vs. unchallenged genetic controls. For EPSPs and QC, *p < 0.05, **p < 0.01, and ***p < 0.001 vs. OK371/+; ##p < 0.01; EPSP and QC analyses done across multiple genotypes by one-way ANOVA with Tukeys post-hoc.

