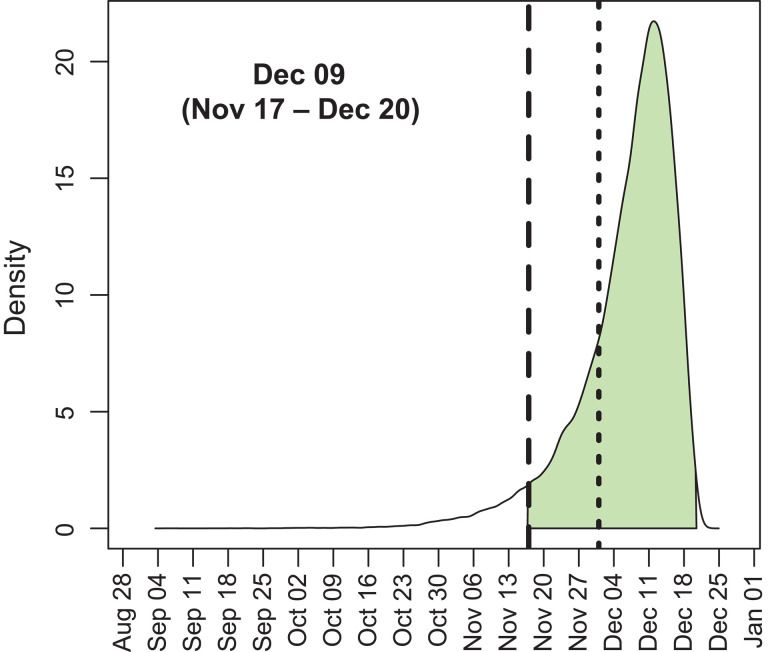
Fig. 1. Posterior distribution for the tMRCA of 583 sampled SARS-CoV-2 genomes circulating in China between December 2019 and April 2020.
Inference was performed by using a strict molecular clock and a Bayesian Skyline coalescent prior. The shaded area denotes 95% HPD. The long-dashed line represents 17 November 2019, and the short-dashed line represents 1 December 2019.

