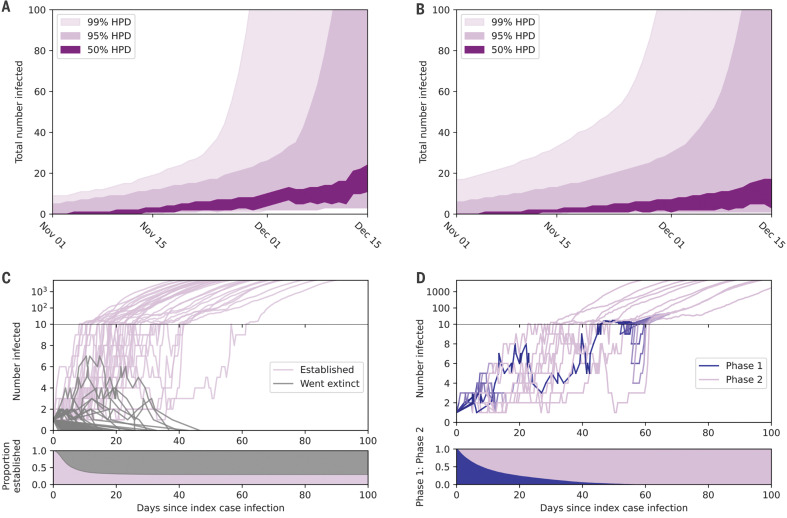
Fig. 4. Epidemic growth in compartmental simulations.
(A) Estimated total number of people infected in late 2019. Dark purple shading represents central 50% HPD, intermediate purple shading represents central 95% HPD, and light purple represents central 99% HPD. (B) Estimated total number of people infected in late 2019 for a two-phase epidemic. (C) Number of people infected over time in a sample of epidemic simulations that established (purple; n = 30) and went extinct (gray; n = 70). The y axis transitions to log scale once 10 people are infected at any given time. The lower panel shows the proportion of simulations that still have at least 1 infected individual over time (persisting epidemics in purple; extinct epidemics in gray). (D) Sample (n = 10) of two-phase epidemic simulations transitioning from less-fit phase 1 (blue) to more-fit phase 2 (purple). Each line represents a single simulation and its transition over time. The lower panel shows the average proportion of phase 1 to phase 2infected individuals over time.

