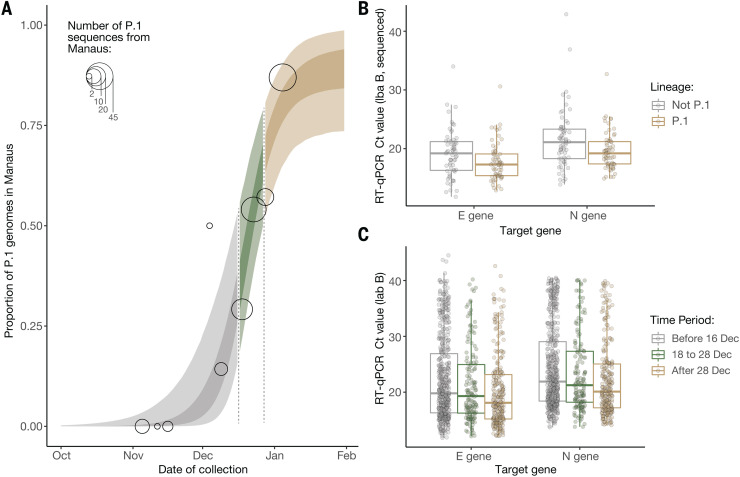
Fig. 3. Temporal variation in the proportion of sequenced genomes belonging to P.1, and trends in quantitative RT-PCR Ct values for COVID-19 infections in Manaus.
(A) Logistic function fitting to the proportion of genomes in sequenced infections that have been classified as P.1 (black circles, size indicating number of infections sequenced), divided up into time periods when the predicted proportion of infections that are due to P.1 is <1/3 (light brown), between 1/3 and 2/3 (green), and greater than 2/3 (gray). For the model fit, the darker ribbon indicates the 50% credible interval, and the lighter ribbon indicates the 95% credible interval. For the data points, the gray thick line is the 50% exact binomial CI, and the thinner line is the 95% exact binomial CI. (B) Ct values for genes E and N in a sample of symptomatic cases presenting for testing at a health care facility in Manaus (laboratory A), stratified according to the period defined in (A) in which the oropharyngeal and nasal swab collections occurred. (C) Ct values for genes E and N in a subsample of 184 infections included in (B) that had their genomes sequenced (dataset A).

