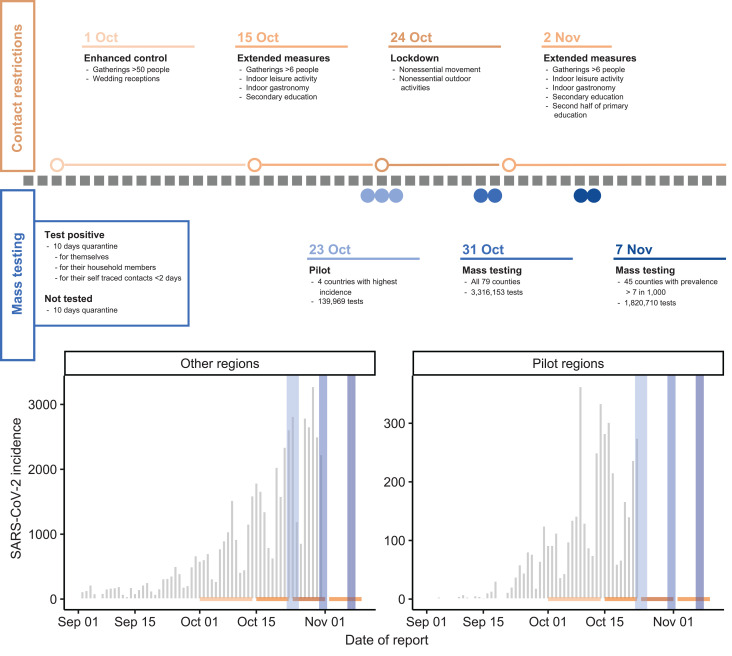
Fig. 1. Overview of interventions and premass testing epidemiology.
(Top) Description of timing and extent of national contact restriction in Slovakia (color intensity indicates intensity of the measures) and timing and extent of the mass testing campaigns. Open circles and lines in respective colors indicate the start and duration of the contact restrictions, and the blue solid circles indicate the days on which mass testing was conducted, although the highest turnout was usually on the first day. (Left) Box illustrating contact-reducing measures for those testing positive and those who chose not to be tested. (Bottom) SARS-CoV-2 infection incidence as reported by the Slovak Ministry of Health and collected through passive symptomtriggered PCR testing. Using the same color coding as at the top, contact interventions are indicated by horizontal lines, and mass testing campaigns are indicated by vertical lines. Data from the passive surveillance subsequent to the respective first mass testing campaign are omitted to clearly illustrate the trends in infection rates that led up to the mass testing and because mass testing is likely to have changed the sensitivity of the passive surveillance, thereby distorting the observation of infection trends that followed mass testing.

