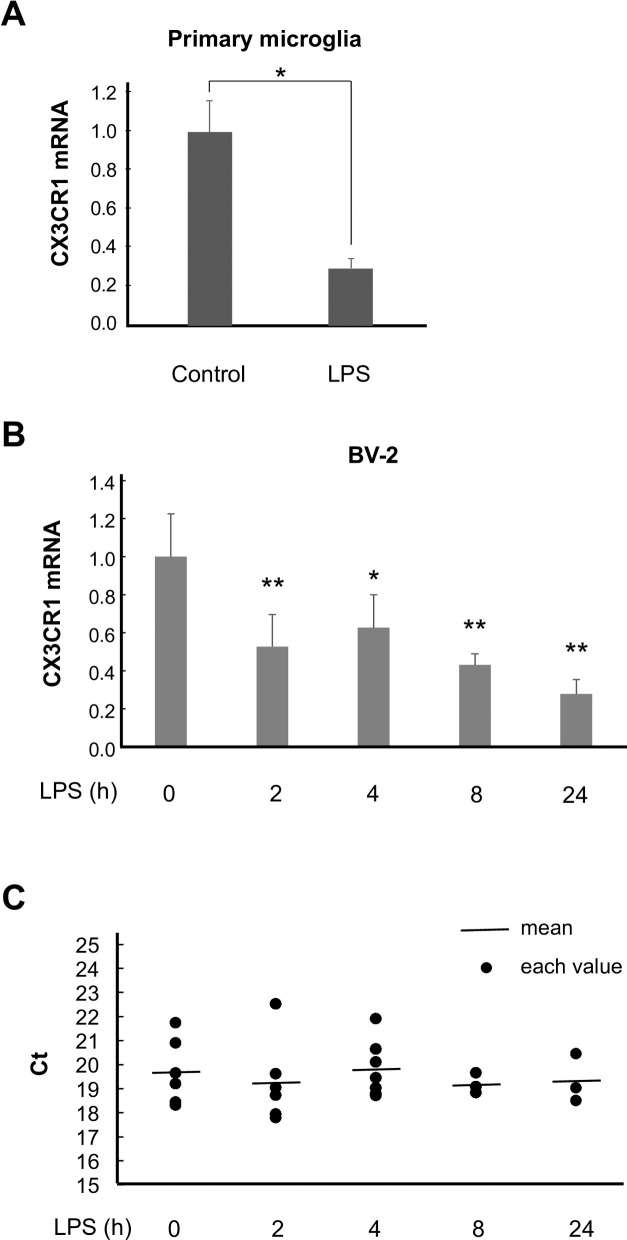
Fig 2. LPS downregulates CX3CR1 gene expression.
(A) Primary microglia were treated with LPS for 4 h, and the cells were subjected to quantitative real-time PCR. n = 3. * p < 0.05 vs. control, Student’s t-test. (B) BV-2 cells were treated with LPS for the indicated times and subjected to quantitative real-time PCR. n = 3–7. * p < 0.05, ** p < 0.01 vs. 0 h, one-way ANOVA followed by Bonferroni’s test. (C) Ct values of GAPDH in (B) were indicated with black circles. The mean values were indicated with black bars. n = 3–7. p = 0.91 vs. 0 h, one-way ANOVA.

