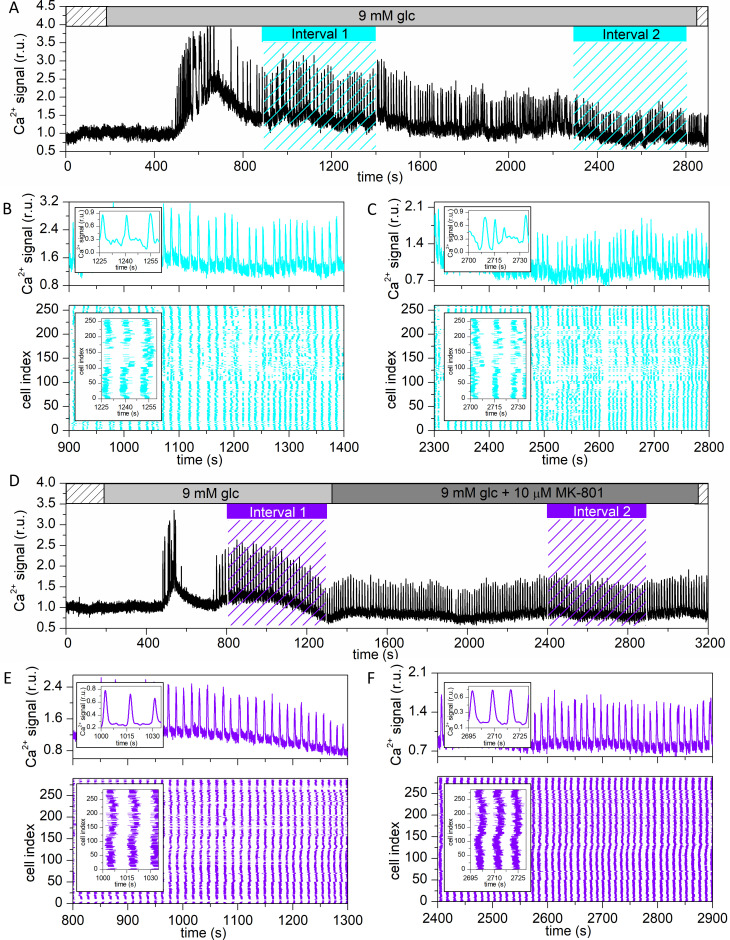
Fig 1. Visualizing beta cell activity in different stimulation protocols.
Representative [Ca2+]ic signals and raster plots in a recording with protocol G (9 mM glucose only) (A) and protocol MK (9 mM glucose + 10 μM MK-801) (D). The two periods of the MK protocol are indicated with light grey and dark grey bars, respectively. The sub-stimulatory period in 6 mM glucose is indicated with dashed bars. Intervals 1 and 2, which were used for further analysis, are indicated in cyan for protocol G and in violet for protocol MK. Panels (B)-(C) and (E)-(F) show outtakes of the calcium signal of a single cell (upper part) and the binarized signal of all cells in the islet (lower part) for both protocols, respectively.

