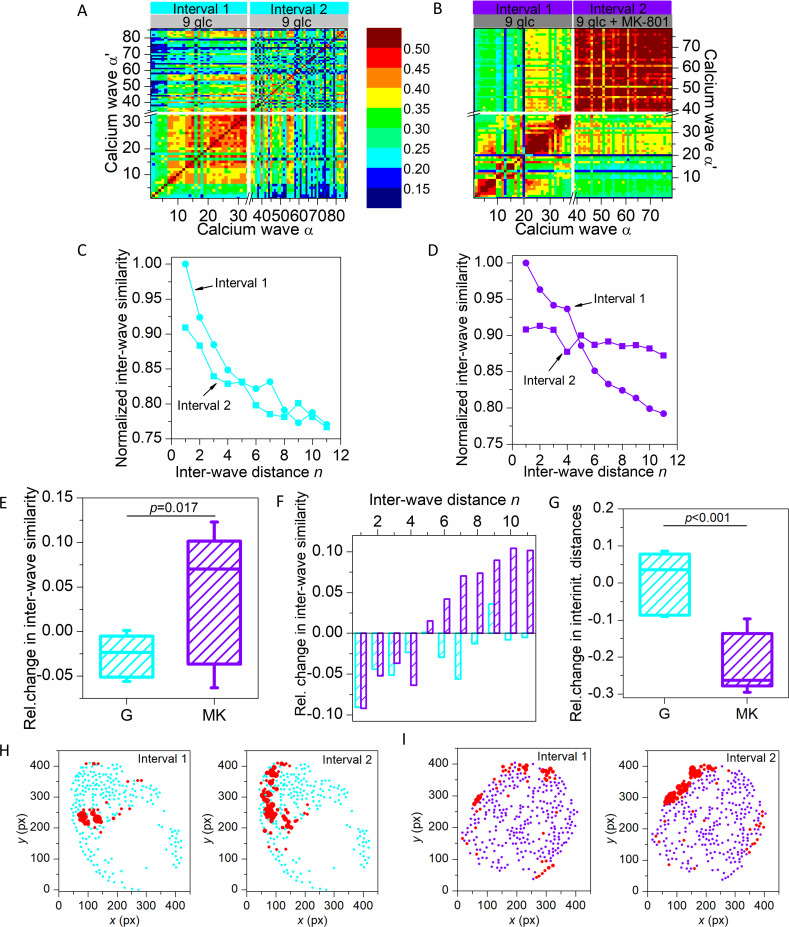
Fig 4. Assessing the inter-wave similarity and spatio-temporal stability of calcium waves.
Inter-wave similarity matrices for all detected calcium waves in a recording in protocol G (A) and protocol MK (B) for interval 1 (light grey bar) and interval 2 (grey bar). Panels (C) and (D) show the normalized average inter-wave similarity of all recordings as a function of inter-wave distance for protocols G (cyan) and MK (violet), respectively. In both panels, interval 1 is shown with round symbols and interval 2 with square symbols, as indicated. In panel (E) the relative change in inter-wave similarity from interval 1 to interval 2 is presented for all recordings with protocol G (cyan) and protocol MK (violet). Panel (F) shows the relative change in inter-wave similarity from interval 1 to 2 as a function of distance for all the recordings in protocol G (cyan) and protocol MK (violet). In panel (G), the relative change in inter-initiator distances for all recordings in protocols G (cyan) and MK (violet) are shown. Panel (H) features representative islets for protocols G (cyan) and MK (violet). Red dots indicate wave initiators and the size of the dots corresponds to the fraction of times the cell initiated a wave. Box-plots are defined the same as in Fig 2. Data were pooled from the following number of mice/cells/islets: 3/1280/9 (protocol G), 5/1622/11 (protocol MK). p–significance level. Statistical test: Student’s t-test (E, G).

