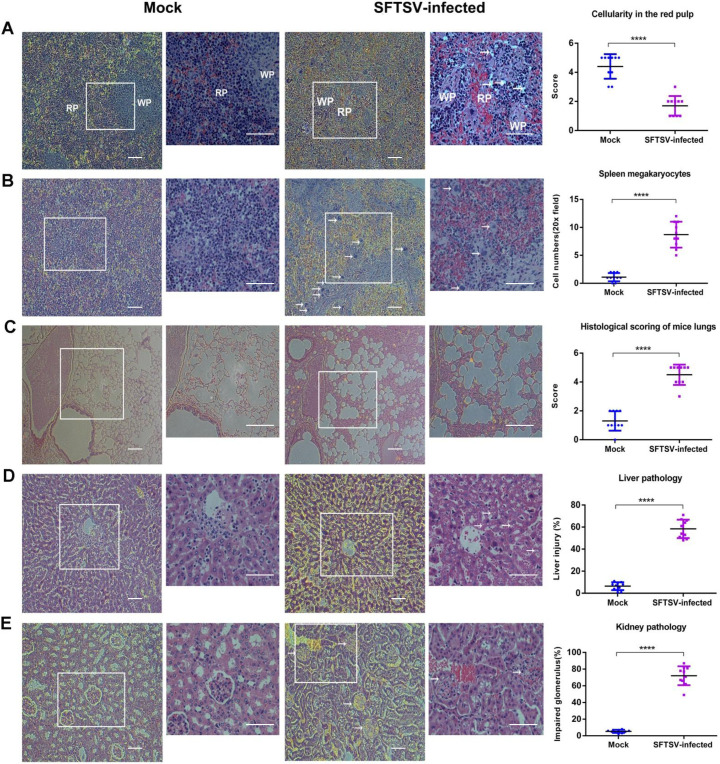
Fig 2. Histopathological lesions in SFTSV-Infected humanized mice.
Dynamic profile of pathological changes in mice infected with SFTSV. Representative H&E-stained tissue sections from SFTSV-infected mice and mock mice. Areas of interest (AOI) are enlarged, and quantitative graphs are presented at the right. (A) Decreased cellularity and obvious lymphocyte depletion in the red pulp (RP) of the spleen at sacrificed day. (B) The number of megakaryocytes increased significantly in the spleen. (C) According to the inflammation of pulmonary interstitium, the thickening of alveolar septum and the structural integrity of pulmonary vesicles, the scores are divided into five grades. In the C images and AOI, structure of the alveoli was obviously destroyed, and the alveoli were filled with inflammatory substances. There was no obvious alveolar septum. (D) In liver, arrowheads show hepatocyte necrosis with shrinking nucleic or hepatocyte degradation with balloon-like empty cytoplasm. (E) In the kidney, arrowheads show impaired renal capsules. Bleeding was observed and the space between glomerulus and surrounding tissue was blurred. In figures, the images and AOI are 100× and 200×, respectively. Bar = 50 μm. In quantitative graphs, red dots and blue dots indicate SFTSV-infected mice and mock mice, respectively. Data are shown as mean±SEM of three independent experiments. (****p <0.001).

