
FIG 3.
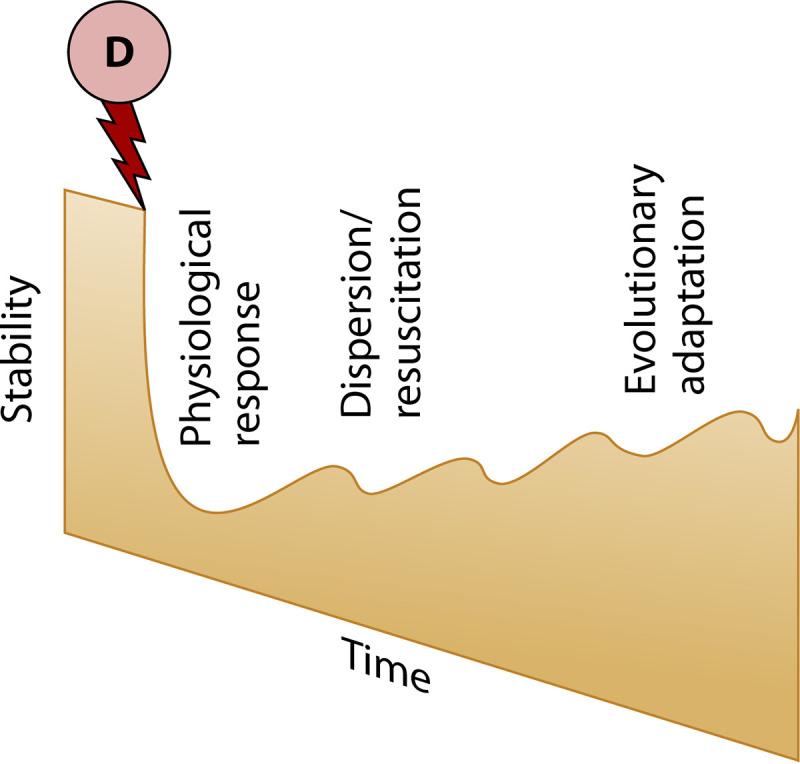
Schematic illustration of how the underlying mechanisms contributing to microbial resilience (stability) operate at different time scales.
Official websites use .gov
A
.gov website belongs to an official
government organization in the United States.
Secure .gov websites use HTTPS
A lock (
) or https:// means you've safely
connected to the .gov website. Share sensitive
information only on official, secure websites.
Schematic illustration of how the underlying mechanisms contributing to microbial resilience (stability) operate at different time scales.