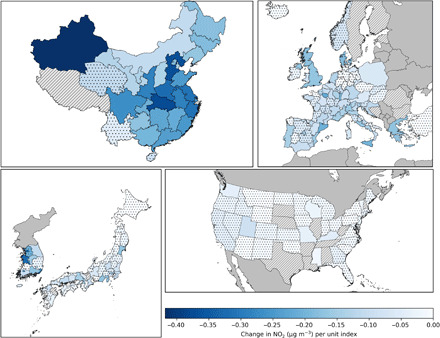
Fig. 1. Changes in population-weighted, regionally averaged NO2 concentration per unit lockdown policy stringency index based on ground monitor data.

Countries in dark gray are not included in the analysis due to the unavailability of monitor data. Hatched regions lack data on more than 10% of the days from 1 January 2016 to 6 July 2020 and are excluded from the results. In dotted regions, changes in population exposure to NO2 with stringency are not statistically significant at the 5% level.
