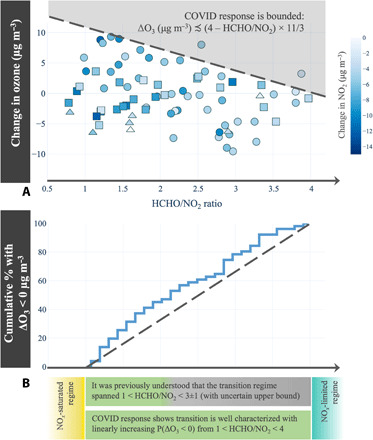
Fig. 2. Changes in ozone as a function of the HCHO-to-NO2 ratio.

(A) Changes in ozone by region as a function of the HCHO-to-NO2 ratio. Circles, squares, and triangles represent European regions, Chinese provinces, and U.S. states, respectively, where NO2 decreases are found to be statistically significant. (B) Cumulative share of the regions in the “extended transition regime” (1 < HCHO/NO2 < 4) with a decrease in ozone as a function of the HCHO-to-NO2 ratio based on pre-lockdown conditions. We find a gradual transition regime between a HCHO-to-NO2 ratio of 1 and 4. The blue line can be interpreted as the probability that a region at a given HCHO-to-NO2 ratio will experience a decrease in ozone given a decrease in NO2. Not all regions with reduced NO2 due to the lockdown have reduced ozone, as HCHO levels also vary (figs. S5 and S6).
