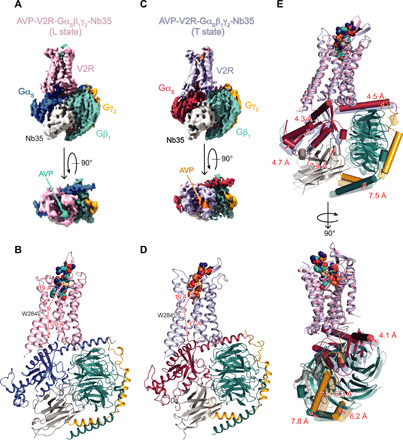
Fig. 3. Structures of AVP-V2R-Gs-Nb35 complexes in L and T conformations.

(A) Orthogonal views of the cryo-EM density maps of the L state of the AVP-V2R-Gs-Nb35 complex and (B) corresponding model as ribbon representation. V2R is colored in pink, Gαs in dark blue, Gβ1 in turquoise, Gγ2 in yellow, Nb35 in gray, and AVP in cyan. In (B), the distances between W2846.48 (at its Cα carbon) and the AVP center of mass (COM) and between W2846.48 and the C-terminal end of α5 helix of Gs (at the Cα carbon of the free carboxylic acid) are shown. (C and D) Corresponding maps and model for the T state. V2R is colored in blue gray, Gαs in raspberry, Gβ1 in turquoise, Gγ2 in yellow, Nb35 in gray, and AVP in orange. In (D), distances are measured as in (B). (E) L and T models are aligned on the V2R chains, and rotations/translations are shown by measuring displacement (in angstroms) of Gαs, Gβ1, Gγ2, and Nb35.
