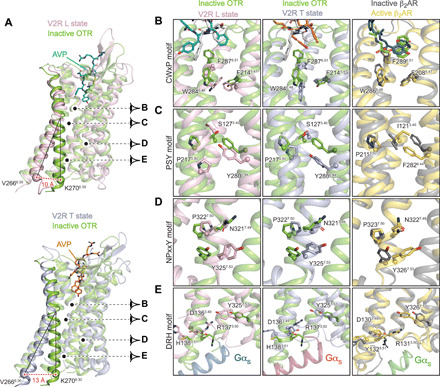
Fig. 6. Active conformations of L and T V2R states, comparison with inactive structure of OTR and active/inactive structures of β2AR.

(A) Large-scale displacement of TM6. The V2R L (pink) and T (blue gray) active structures are aligned onto that of the inactive OTR (green) structure. Residue 6.30 (Ballesteros-Weinstein numbering) is chosen as a reference (V266 in V2R and K270 in OTR) for measuring the outward movement of TM6: 10 and 13 Å between OTR and V2R in the L and T states, respectively. Activation of molecular switches along the helix bundle of the V2R is viewed in (B) to (E). For comparison, rearrangements of those corresponding motifs in the b2AR are depicted. (B) Rotameric toggle switch in the conserved CWxP motif. Position of W6.48, F6.51, and F5.47 (284, 287, and 214 in V2R) are shown. (C) Rearrangement of the PSY transmission switch. The P5.50-S3.40-Y6.44 motif (217, 127, and 280 in V2R) is equivalent to the PIF motif in other GPCRs. (D) Rotation of the NPxxY conserved motif in TM7. The conserved Y7.53 (position 325 in V2R) is shown. (E) Breaking of the conserved ionic lock in TM3. Upon activation of V2R, the ionic bond between D1363.49 and R1373.50 is broken, and R1373.50 projects to Y3257.53.
