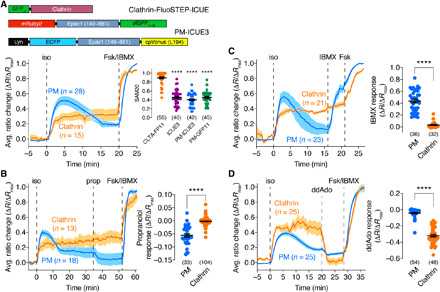
Fig. 5. Transmembrane ACs regulate sustained cAMP production at clathrin after β-AR stimulation.

(A) Top: GFP11-clathrin (from CLTA-FP11 cells), FluoSTEP-ICUE, and PM-targeted ICUE3 (PM-ICUE3). Bottom: CLTA-FP11 cells expressing FluoSTEP-ICUE (clathrin) or PM-ICUE3 (PM) were stimulated with 10 μM isoproterenol (iso), 50 μM Fsk, and 100 μM IBMX (Fsk/IBMX). Representative average time courses (left) showing G/R (clathrin) or cyan/yellow (PM) emission ratio change (ΔR/ΔRmax; see Materials Methods). Right: Sustained activity metric at 20 min (SAM20) following iso stimulation in CLTA-FP11 cells expressing FluoSTEP-ICUE (CLTA-FP11), diffusible ICUE3 (ICUE3), or PM-ICUE3 or in HEK293T cells expressing Lyn-FRB-GFP11/FluoSTEP-ICUE (PM-GFP11). ****P < 0.0001 versus CLTA-FP11; Kruskal-Wallis test followed by Dunn’s multiple comparisons test. (B) CLTA-FP11 cells expressing FluoSTEP-ICUE or PM-ICUE3 were stimulated with 10 μM iso, 10 μM propranolol (prop), and Fsk/IBMX. Left: Representative average time courses showing G/R (clathrin) or cyan/yellow (PM) emission ratio changes (ΔR/ΔRmax). Right: Summary of prop-induced ratio change (ΔR/ΔRmax) for FluoSTEP-ICUE (clathrin) and PM-ICUE3 (PM). (C) CLTA-FP11 cells expressing FluoSTEP-ICUE or PM-ICUE3 were stimulated with 10 μM iso, 100 μM IBMX, and 50 μM Fsk. Left: Representative average time courses showing G/R (clathrin) or cyan/yellow (PM) emission ratio changes (ΔR/ΔRmax). Right: Summary of IBMX-induced ratio change (ΔR/ΔRmax) for FluoSTEP-ICUE (clathrin) and PM-ICUE3 (PM). (D) CLTA-FP11 cells expressing FluoSTEP ICUE or PM-ICUE3 were stimulated with 10 μM iso, 100 μM ddAdo, and Fsk/IBMX. Left: Representative average time courses showing G/R (clathrin) or cyan/yellow (PM) emission ratio changes (ΔR/ΔRmax). Right: Summary of ddAdo-induced ratio change (ΔR/ΔRmax) for FluoSTEP-ICUE (clathrin) and PM-ICUE3 (PM). ****P < 0.0001, unpaired two-tailed Student’s t test with Welch’s correction [in (B) and (D)]. Solid lines in time courses indicate average responses; shaded areas denote SEM. Horizontal lines in scatter plots indicate means ± SEM. Values shown in parentheses indicate number of cells.
