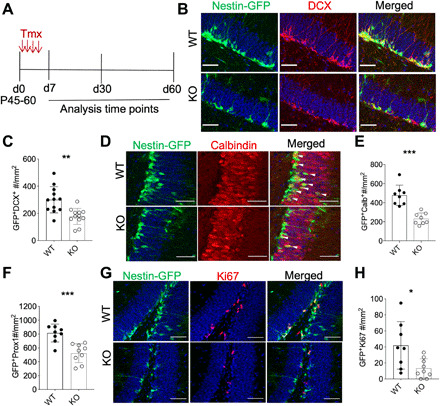
Fig. 3. Genetic lineage tracing shows fewer adult born neurons from Tcf4-deleted nestin-expressing progenitors.

(A) Schematic for genetic lineage tracing experimental regime. (B and C) Representative images (B) quantitation (C) of genetic reporter-based tracing of progenitors 30 days after deletion for DCX expression. (D) Genetic reporter-based tracing of progenitors 60 days after deletion for Calbindin expression. (E and F) Quantitation of genetically traced Calbindin+ve and Prox1+ve mature neurons. (G and H) Representative images (G) quantitation (H) of genetic lineage tracing for Ki67+ve progeny at day 7 after deletion. n = 3 animals per genotype, each dot represents a section from a brain, and error bar represents SD. (unpaired t test, *P < 0.01, **P < 0.001, and ***P < 0.0003). Scale bars, 50 μm.
