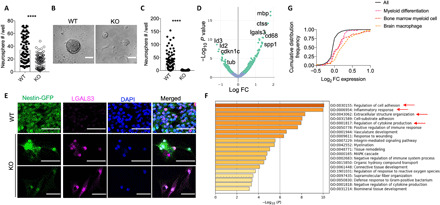
Fig. 5. Tcf4-deleted neural progenitors gain myeloid inflammatory potential.

(A) Neurosphere counts from WT and Tcf4-deleted hippocampal progenitors (NPC) (each dot represents neurosphere counts per well from three brains per genotype). (B) Representative neurosphere phenotype. (C) Secondary neurosphere counts; n = 3 mice per genotype; error bar represents SD, P < 0.0001. (D) Volcano plot showing differentially expressed genes in WT versus KO neurospheres, (P < 0.05, green dots). FC, fold change. (E) Representative images of genetically traced (GFP+) WT and KO NPC for the expression of LGALS3. Scale bars, 50 μm. (F) Enriched ontology cluster analysis for the top 50 up-regulated genes in KO progenitors. (G) Cumulative frequency distribution curve showing up-regulation of “myeloid” gene sets in KO progenitors’ transcriptome. MAPK, mitogen-activated protein kinase.
