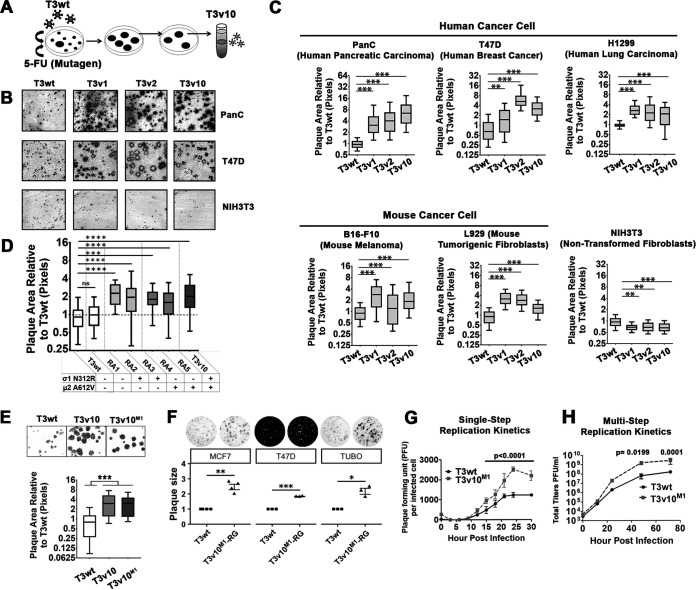
FIG 1.
A mutation in reovirus M1-encoded μ2 promotes replication on cancer cells. (A) Schematic shows how wild-type reovirus T3wt was replicated in L929 tumorigenic mouse fibroblasts in the presence of 5-fluorouracil, generating variants (including T3v10) that produced larger plaques. (B) Plaque sizes of T3v10 were compared with those of previously characterized variants T3v1 and T3v2. All three variants selectively replicated in T47D (breast cancer) and PanC (pancreatic cancer) cells but had restricted replication in NIH3T3 (nontransformed mouse fibroblast). (C) Plaque sizes associated with each variant were compared in a panel of cell lines and represented by box-and-whisker plots (n = 3, mean ± standard deviation [SD]; one-way analysis of variance [ANOVA] with Dunnett’s multiple-comparison test). (D) Mutations in σ1 and μ2 found in T3v10 were segregated by coinfection of L929 cells with T3v10 and T3wt. Five reassortants (RA) containing single-gene mutations in σ1 or μ2, as indicated, were subjected to plaque size analysis relative to parental viruses T3v10 and T3wt (n = 2, mean ± SD). (E) Plaque size of reassortant RA2 from (D), renamed T3v10M1, was compared with those of T3wt, T3v10M1, and parental viruses T3v10 in L929 cells (n = 4, mean ± SD; one-way ANOVA with Dunnett’s multiple-comparison test). (F) Plaque size of T3wt and T3v10M1 created by reverse genetics (RG) was evaluated in two human breast cancer cell lines (MCF7 and T47D) and a murine one (TUBO) (n = 4 for MCF7, n = 3 for T47D and TUBO; mean ± SE, t test). (G) Single-cycle progeny production per infected cell was compared between T3wt and T3v10M1. L929 cells were infected with an infectious dose to equivalently infect ∼70% of cells (T3wt multiplicity of infection [MOI] = 2.7; T3v10M1 MOI = 19.5). At indicated hours postinfection (hpi), cell lysates were subjected to plaque assay. To determine PFU per infected cells, total titers were normalized to the percentage of infected cells empirically determined for each independent experiment by flow cytometric analysis with polyclonal antireovirus antibodies at 15 hpi (n = 5; mean ± SD; two-way ANOVA, Sidak’s multiple-comparison test). (H) Multicycle progeny production was monitored in L929 cells infected by T3wt or T3v10M1 at an MOI of 0.01. At indicated hours postinfection (hpi), we collected cell lysates and calculated PFU by plaque assay (n = 3; mean ± SD; two-way ANOVA, Sidak’s multiple-comparison test). *, P < 0.05; **, P < 0.01; ***, P < 0.001; ****, P < 0.0001.

