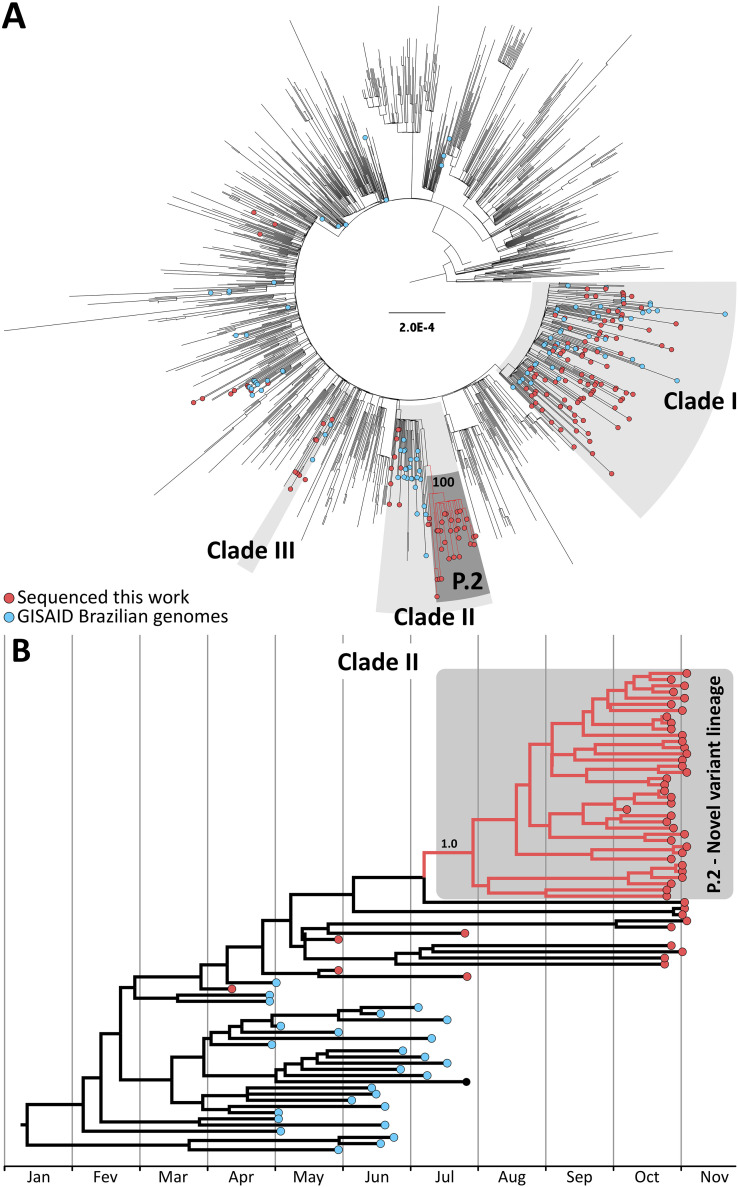
FIG 1.
Phylogeny and timescale of P.2 lineage. (A) Maximum-likelihood tree of 1,377 SARS-CoV-2 genomes, including the 180 new Brazilian genomes generated in this work. We randomly sampled one genome/week/country from available samples in GISAID with collection dates ranging from May to November. Brazilian sequences with collection dates from May to November were all added to the data set (see Table S2). We ran IQTree 2.0.3 (10) under a general time-reversible (GTR) model of nucleotide substitution (11) with empirical base frequencies and invariant sites. Tips are colored according to their origin. Genomes generated from this work are red, other Brazilian genomes are blue, and genomes from other countries are not colored. Gray areas represent the three clades where Brazilian viruses are concentrated. The emergent lineage identified in this work, P.2, is in a dark-gray box and highlighted with red branches. The approximate likelihood ratio test (aLRT) support value for the branch holding P.2 monophyly is shown. (B) A time-scaled tree of clade II was estimated under a strict molecular clock in BEAST v.1.10.4 (12) using the GTR+I (11) nucleotide substitution model and assuming an exponential growth tree prior and a normal prior for the clock rate (mean = 8 × 10⁻⁴ and standard deviation = 0.1 × 10⁻⁵). The convergence of the Markov chain Monte Carlo chains, which were run at least for 50 million generations and sampled every 1,000th step, was inspected using Tracer v.1.7.1 (13). Maximum clade credibility (MCC) summary trees were generated using TreeAnnotator v.1.10.4 (12). Red circles in the tip nodes represent genomes generated in this work, and blue circles indicate other Brazilian samples. P.2 is identified by the red branches and highlighted in a gray box. The posterior probability of the branch holding P.2 monophyly is shown.

