FIG 1.
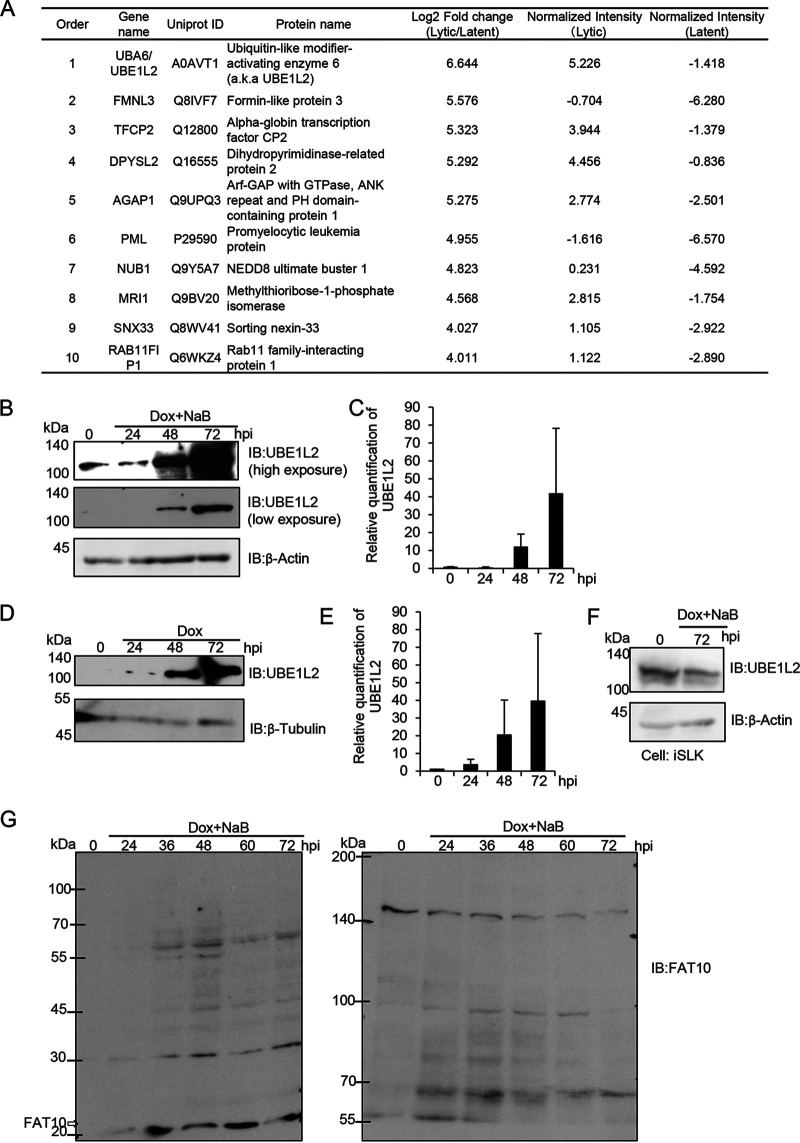
The expression levels of UBE1L2 and FAT10 are increased during KSHV lytic replication. (A) The upregulated cellular proteins in lytic-phase-induced iSLK-rKSHV.219 cells. The iSLK-rKSHV.219 cells were treated with (or without) Dox and NaB for 72 h and harvested. Quantitative LC-MS/MS was then used to evaluate protein expression during latent versus lytic replication. The protein expression level ranks (orders), gene names, UniProt IDs, protein names, and quantitative values of the top 10 proteins that were upregulated 72 h after lytic induction in iSLK-rKSHV.219 cells are summarized in the table. In the Log2 Fold change (Lytic/Latent) column of the table, log2-transformed fold changes were calculated from iSLK-rKSHV.219 cells during lytic infection and latent infection. In the Normalized Intensity (Lytic and Latent) columns, the values show the log2-transformed intensities after median normalization. (B to E) The upregulation of UBE1L2 (also known as UBA6) in lytic-induced Vero and SLK cells harboring the KSHV genome. In order to induce lytic replication, the iSLK-rKSHV.219 (B and C) and iSLK cells (F) were treated with Dox and NaB, and the iVero-BAC16 cells were treated with Dox (D and E). Lytic-induced cells were harvested at 24 to 72 h postinduction (hpi) followed by immunoblotting (IB) with anti-UBE1L2 antibody. UBE1L2 expression levels in lytic-induced iSLK-rKSHV.219 cells (B) and lytic-induced iVero-BAC16 cells (D). The quantification of UBE1L2 levels in lytic-induced iSLK-rKSHV.219 cells (C) and lytic-induced iVero-BAC16 cells (E) were performed by densitometric analysis using ImageJ software. The levels of UBE1L2 were normalized to the β-actin levels. Immunoblotting analyses were repeated at least three times, and representative data are shown in panels B and D. (F) The expression of UBE1L2 was not affected by Dox treatment. The iSLK cells were treated with Dox for 72 h and subjected to immunoblotting with anti-UBE1L2 antibody. (G) Production of free FAT10 and FAT10 conjugates in lytic-induced iSLK-rKSHV.219 cells. Cells were treated with Dox and NaB to induce lytic replication, and the cells were harvested at 24 to 72 hpi followed by cell lysis. Lysates (4 μg of protein/lane) were subjected to SDS-PAGE on 15% (left panel) or 6% (right panel) acrylamide gels. The proteins were transferred onto nitrocellulose membranes and blotted with anti-FAT10 antibody to monitor FAT10 expression and FAT10ylation.

