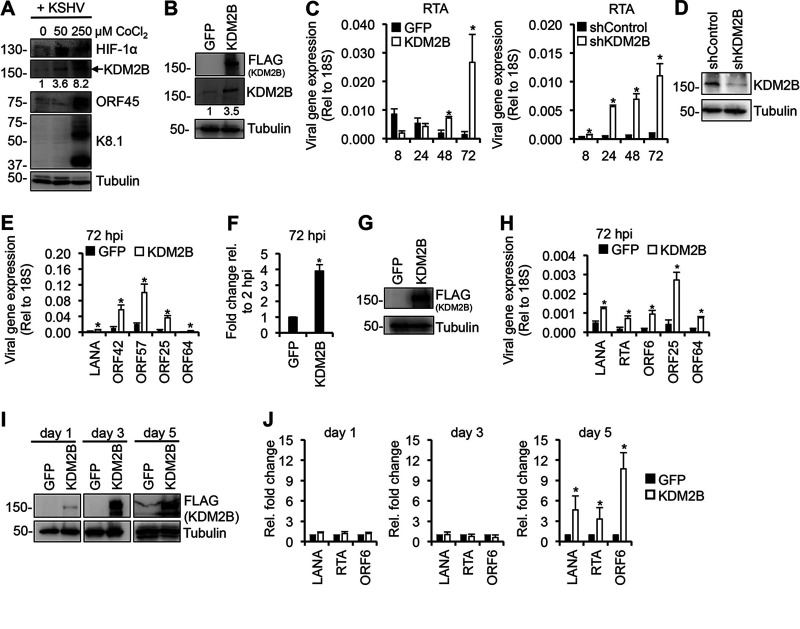
FIG 1.
Increased lytic gene expression following de novo KSHV infection upon dysregulation of KDM2B expression. (A) SLK cells were treated with CoCl2 for 24 h to induce hypoxia followed by KSHV infection in the presence of CoCl2 for 72 h. Immunoblot analysis of host (HIF-1α and KDM2B) and viral proteins are shown. HIF-1α induction is an intrinsic marker of hypoxia. The numbers below the KDM2B blots represent the quantification of KDM2B bands in hypoxia samples relative to the normoxia sample (0 μM CoCl2). (B) Immunoblot analysis of KDM2B expression using anti-FLAG and anti-KDM2B antibodies. (C) SLK cells were transduced with lenti-GFP and lenti-3×FLAG-KDM2B or lenti-shControl and lenti-shKDM2B for 3 days and then infected with KSHV for various time periods. RT-qPCR analysis of RTA expression relative to 18S is shown. (D) Immunoblot analysis of KDM2B expression in the shRNA-treated SLK cells. (E) Viral gene expression measured by RT-qPCR relative to 18S at 72 hpi. (F) Viral DNA level at 72 hpi was measured by qPCR, normalized to the host DNA level, and then calculated relative to 2 hpi in GFP-OE and KDM2-OE cells. (G) EA.hy926 cells were transduced with lenti-GFP or lenti-3×FLAG-KDM2B for 3 days and then infected with KSHV for 3 days. Immunoblot analysis of KDM2B expression using anti-FLAG antibody is shown. (H) Viral gene expression measured by RT-qPCR relative to 18S at 72 hpi. (I) BCBL1 cells were transduced with lenti-GFP or lenti-3×FLAG-KDM2B for 1, 3, or 5 days. 3×FLAG-KDM2B expression was tested by anti-FLAG immunoblotting. Tubulin was used as a loading control. (J) RT-qPCR analysis of viral mRNAs in KDM2B-OE cells relative to GFP-OE cells at 1, 3, and 5 days. t test was performed between GFP-OE and KDM2B-OE or shControl and shKDM2B, and P < 0.05 (*) was considered statistically significant. The numbers on the left side of immunoblots in this and later figures represent the molecular weight in kilodaltons (kDa).

