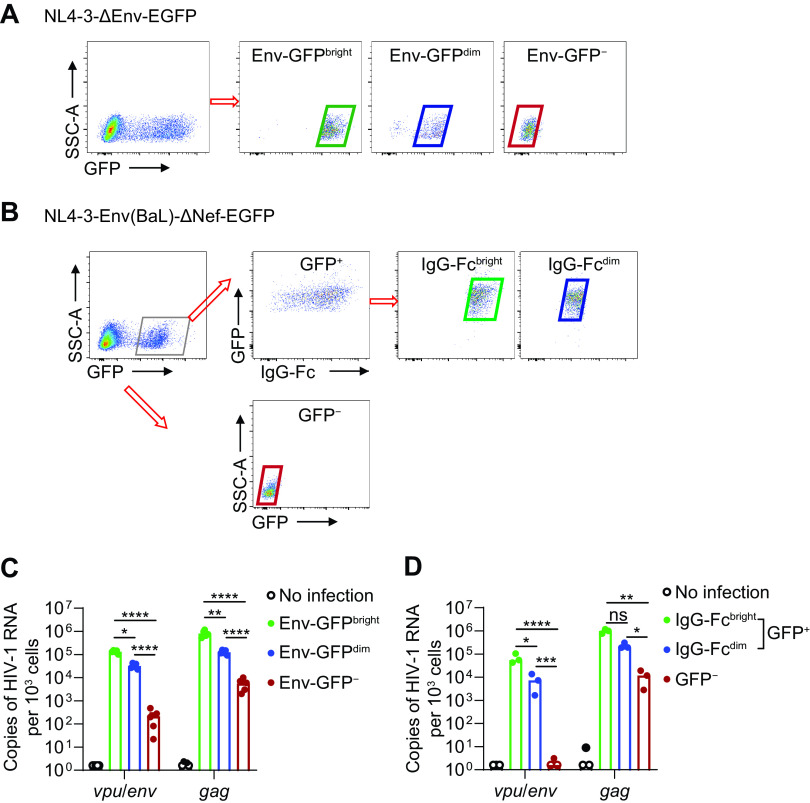
FIG 2.
Correlation between HIV-1 vpu/env mRNA level and Env protein level. (A) Sorting strategy for Env-GFPBright, Env-GFPdim, and Env-GFP− cells. Activated CD4+ T cells were infected with NL4-3ΔEnv-EGFP. Env-GFPBright, Env-GFPdim, and Env-GFP− cells were sorted based on green fluorescent protein (GFP) intensity on day 3 postinfection. (B) Sorting strategy for IgG-FcBright, IgG-Fcdim, and GFP− cells. Activated CD4+ T cells were infected with NL4-3-Env(Ba-L)-Δnef-EGFP. On day 3 postinfection, surface Env protein was labeled by PGT121 followed with anti-human IgG Fc antibodies. (C and D) Cell-associated vpu/env or gag mRNA was measured by qPCR. P values were calculated by one-way analysis of variance (ANOVA) with Tukey’s test. *, P < 0.05; **, P < 0.01; ***, P < 0.001; ****, P < 0.0001.

