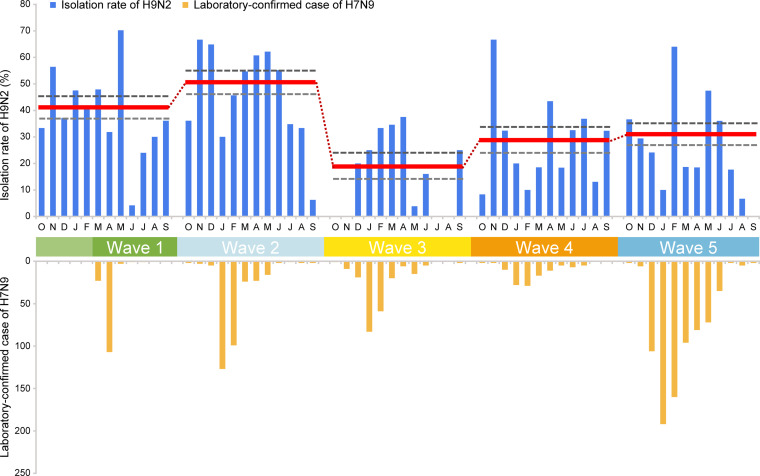
FIG 3.
Rate of isolation (percent) of H9N2 influenza viruses in chicken flocks reporting illness and number of human H7N9 cases in the five epidemic waves. Red horizontal lines (with connecting dots) indicate mean annual isolation rates, and gray horizontal dashed lines indicate 95% confidence intervals (CIs). The 2013 H9N2 isolation rate data obtained during the first epidemic wave are from our previous study (8). The total numbers of human cases from wave 1 to wave 5 were 135, 320, 226, 119, and 758, respectively.

