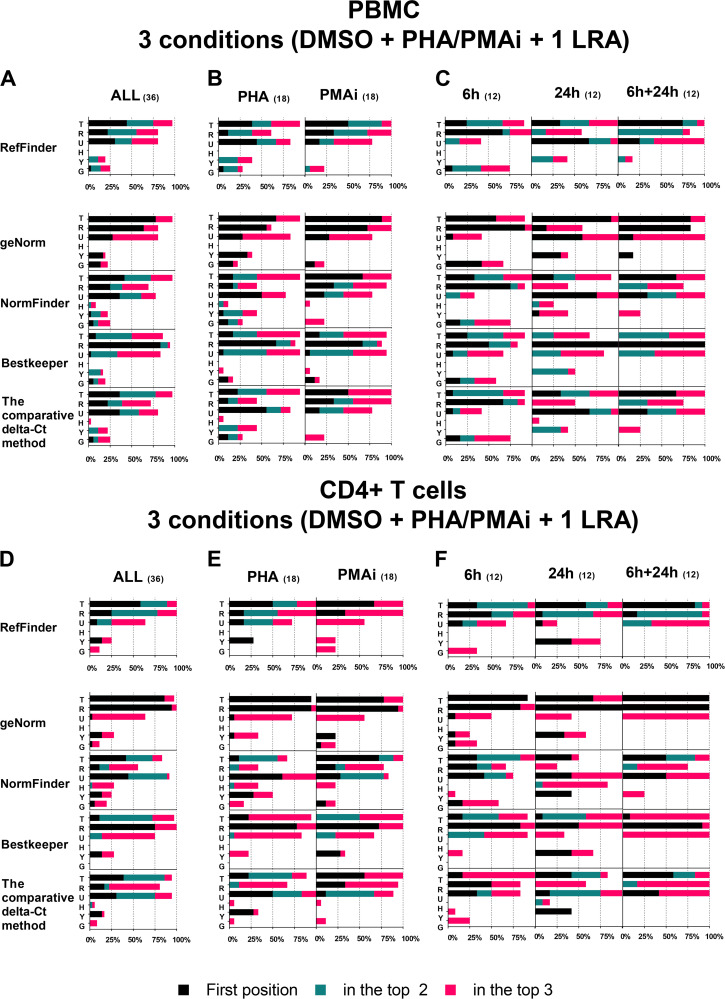
FIG 3.
Summary of the reference gene stability using different algorithms and RefFinder tools in PBMCs or CD4+ T cells. Frequency (%) of each RG ranking position using RefFinder, geNorm, NormFinder, BestKeeper and the comparative ΔCT method when three conditions (DMSO plus PHA/PMAi plus one LRA) were analyzed. Frequency calculated analyses of all PBMC data sets (A), of PBMC data set including PHA or PMAi (B), of PBMC data set including 6 h, 24 h, or both (C), of all CD4+ T cell data sets (D), of CD4+ T cell data set including PHA or PMAi (E), and of CD4+ T cell data set including 6 h, 24 h, or both (F). x axis, frequency that each RG is in the first position (black), in the top two positions (blue), and in the top three positions (red). Numbers in parentheses indicate the total number of analyses.

