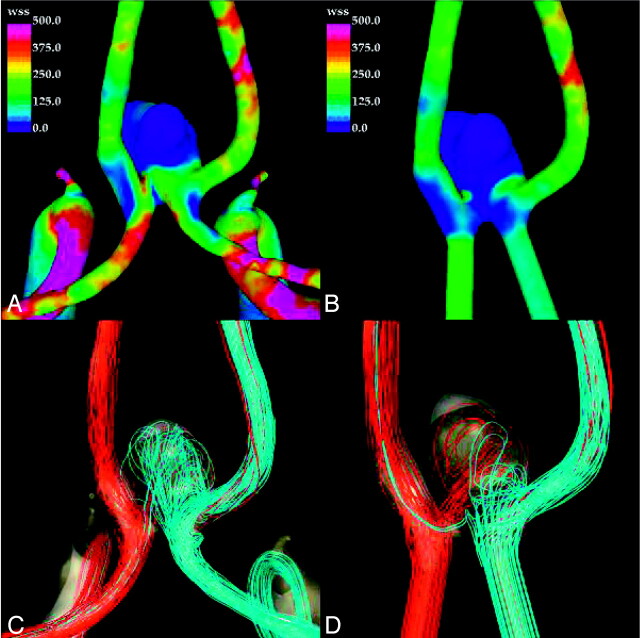
Fig 5.
Visualizations of the hemodynamics of anterior communicating artery aneurysm (patient 4) at peak systole: wall shear stress distribution in the original model (A), wall shear stress distribution in the truncated model (B), streamlines in the original model (C), and streamlines in the truncated model (D). Streamlines are colored according to velocity magnitude.

