Abstract
The mechanism of intercellular transport of Wnt ligands is still a matter of debate. To better understand this issue, we examined the distribution and dynamics of Wnt8 in Xenopus embryos. While Venus-tagged Wnt8 was found on the surfaces of cells close to Wnt-producing cells, we also detected its dispersal over distances of 15 cell diameters. A combination of fluorescence correlation spectroscopy and quantitative imaging suggested that only a small proportion of Wnt8 ligands diffuses freely, whereas most Wnt8 molecules are bound to cell surfaces. Fluorescence decay after photoconversion showed that Wnt8 ligands bound on cell surfaces decrease exponentially, suggesting a dynamic exchange of bound forms of Wnt ligands. Mathematical modeling based on this exchange recapitulates a graded distribution of bound, but not free, Wnt ligands. Based on these results, we propose that Wnt distribution in tissues is controlled by a dynamic exchange of its abundant bound and rare free populations.
Research organism: Xenopus
Introduction
The Wnt family of secreted signaling proteins has diverse roles in animal development, stem cell systems, and carcinogenesis (Clevers et al., 2014; Loh et al., 2016; Nusse and Clevers, 2017). It has been generally accepted that in the extracellular space, morphogenic Wnt ligands form a concentration gradient by dispersal (Clevers et al., 2014; Kiecker and Niehrs, 2001; Müller et al., 2013; Smith, 2009; Strigini and Cohen, 2000; Tabata and Takei, 2004; Yan and Lin, 2009; Zecca et al., 1996; Zhu and Scott, 2004). In contrast to this classical view, evidence also suggests dispersal-independent functions of Wnt ligands. For instance, a membrane-tethered form of Wingless (Wg) can recapitulate an almost normal pattern of Drosophila wings, suggesting that dispersal of Wg is dispensable for patterning (Alexandre et al., 2014). This dispersal-independent patterning can be explained by gradual attenuation of Wg expression in distally localized cells in which Wg was formerly expressed. However, it remains unclear to what extent dispersal-dependent and/or -independent mechanisms contribute to the graded distribution of Wnt proteins in tissue patterning.
Visualization of Wnt ligands is essential to understand their distributions. In the wing disc of Drosophila, Wg proteins are widely distributed from wing margin cells, where Wg is expressed (Strigini and Cohen, 2000; Zecca et al., 1996). Furthermore, long-range dispersal of Wg was evidenced by an experiment in which Wg was captured by distally expressed Frizzled2, a Wg receptor (Chaudhary et al., 2019). Similarly, endogenous Wnt ligands tagged with fluorescent proteins showed long-range distributions in C. elegans (Pani and Goldstein, 2018). In addition to these observations in invertebrates, we found that endogenous Wnt8 ligands disperse far from their source cells in Xenopus embryos (Mii et al., 2017). On the other hand, mouse Wnt3 accumulates within a few cell diameters of its source cells in the microenvironment of the intestine (Farin et al., 2016). These studies show that Wnt ligands apparently disperse in tissues and embryos, although the dispersal range varies. Importantly, in many of these studies, Wnt ligands accumulate locally on cell surfaces, showing punctate distributional patterns (Pani and Goldstein, 2018; Strigini and Cohen, 2000; Zecca et al., 1996). Furthermore, we demonstrated that Wnt8 and Frzb, a secreted Wnt inhibitor, accumulate separately and locally on cell surfaces in Xenopus embryos (Mii et al., 2017). However, these punctate accumulations on cell surfaces, largely ignored in the literature in the context of Wnt gradient formation, raise the question of whether such accumulations contribute to formation of concentration gradients in tissues and embryos.
Studies in Drosophila wing disc have shown that cell surface scaffolds, such as heparan sulfate (HS) proteoglycans (HSPGs), are required for both distribution and delivery of morphogens, including Wg, Hedgehog (Hh), and Decapentaplegic (Dpp) (Franch-Marro et al., 2005; Lin, 2004; Yan and Lin, 2009). From these studies, the ‘restricted diffusion’ model, in which morphogens are transferred extracellularly by interacting with cell surface scaffolds, has been proposed (Yan and Lin, 2009). In this model, the movement of each morphogen molecule is constrained in a ‘bucket brigade’ fashion by interactions with cell surface scaffolds. As a result of continuous interactions, morphogen molecules are slowly transferred (Han et al., 2005; Yan and Lin, 2009 #152; Kerszberg and Wolpert, 1998; Takei et al., 2004). However, it seems difficult to explain local accumulations of Wnt proteins by the restricted diffusion mechanism, because passive diffusion alone should result in smoothly decreasing gradients. On the other hand, we recently showed that HSPGs on cell surfaces are discretely distributed in a punctate manner, which varies with heparan sulfate (HS) modification, forming two different types of HS clusters, N-sulfo-rich and N-acetyl-rich forms (Mii et al., 2017). Notably, Wnt8 and Frzb, a secreted Frizzled-related protein (sFRP), accumulate separately on N-sulfo-rich and N-acetyl-rich HS clusters, respectively. Frzb expands the distribution and signaling range of Wnt8 by forming heterocomplexes (Mii and Taira, 2009), and Wnt8/Frzb complexes are colocalized with N-acetyl-rich HS clusters (Mii et al., 2017). N-sulfo-rich clusters are frequently internalized together with Wnt8, whereas N-acetyl-rich HS clusters tend to remain on the cell surface. This difference in stability on the cell surface may account for the short-range distribution of Wnt8 and the long-range distribution of Frzb (Mii and Taira, 2009; Mii et al., 2017) and suggests that the distribution of HS clusters should be considered in order to understand extracellular dynamics of Wnt ligands (Mii and Takada, 2020).
To explain the dynamics of Wnt ligands in tissues, quantitative analyses of Wnt ligands are required. Dynamics of secreted proteins have been investigated using fluorescence recovery after photobleaching (FRAP) (Sprague and McNally, 2005; Sprague et al., 2004) and fluorescence correlation spectroscopy (FCS), although optimal ranges for diffusion coefficients differ (Hess et al., 2002; Kicheva et al., 2012; Müller et al., 2013; Fradin, 2017). For example, FRAP measurements have shown that Dpp and Wg diffuse slowly in the Drosophila wing disc with diffusion coefficients ranging from 0.05 to 0.10 μm2/s, suggestive of the restricted diffusion model (Kicheva et al., 2007). In contrast, FCS measurements of FGF8 in zebrafish embryos showed fast, virtually free diffusion, with a diffusion coefficient of ~50 μm2/s (Yu et al., 2009). Furthermore, in contrast to the FRAP results, free diffusion of Dpp measured in the Drosophila wing disc using FCS yielded a diffusion coefficient of ~20 μm2/s (Zhou et al., 2012). FCS is based on fixed-point scanning within a confocal volume (typically sub-femtoliter) for several seconds, while FRAP evaluates considerably larger regions of photobleaching/photoconversion, containing tens or hundreds of cells (Rogers and Schier, 2011) and spanning long time windows (typically several hours). Under these experimental conditions for FRAP, it is proposed that diffusion of secreted proteins is affected by zigzag paths of the narrow intercellular space between polygonal epithelial cells, instead of an open, unobstructed space (hindered diffusion model) (Müller et al., 2013), and/or by endocytosis, which reduces the concentration of the diffusing species in the extracellular space. Thus, we need exercise caution when comparing data derived from FRAP and from FCS analyses.
In this study, we examined extracellular dynamics of Wnt8 and Frzb, both of which are involved in anteroposterior patterning of vertebrate embryos (Clevers and Nusse, 2012; Kiecker and Niehrs, 2001; MacDonald et al., 2009; Mii et al., 2017). First, we visualized their localization in Xenopus embryos by fusing them with fluorescent proteins and we examined their dispersion by capturing them in distant cells. We also examined their dispersal dynamics using FCS and fluorescence decay after photoconversion (FDAP) measurements in embryonic tissue. In particular, we refined FDAP-based analysis by focusing on a limited area at the cell boundary, which enabled us to quantify dynamics comparable to those measured by FCS. Based on these results and our previous findings, we propose a basic mathematical model to explain distribution and dispersion of secreted proteins.
Results
Extracellular distributions of secreted proteins depend on interactions with cell-surface molecules
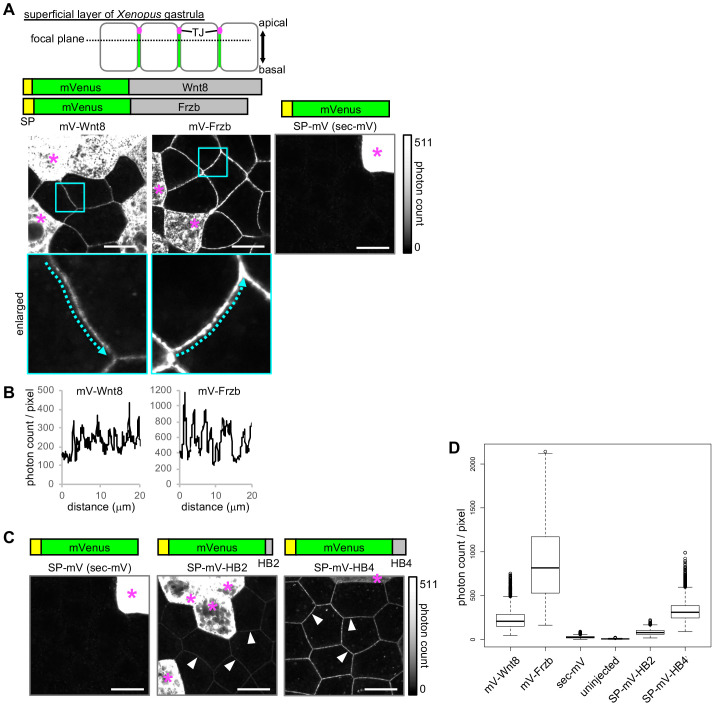
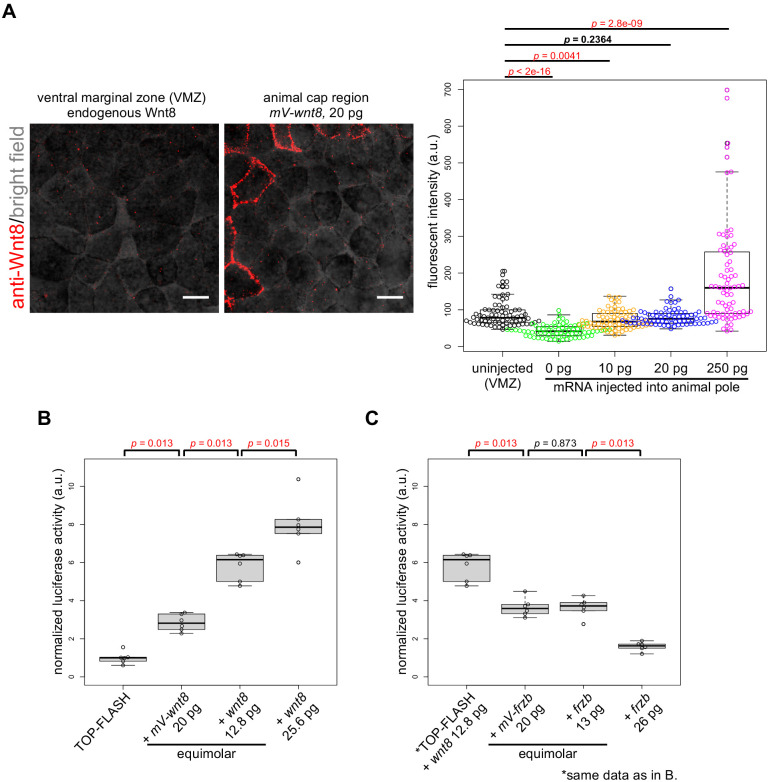
As we have previously shown (Mii et al., 2017), Wnt8 and Frzb fused with monomeric Venus (mV) were visualized along cell boundaries when expressed in Xenopus embryos (Figure 1A). We note that biological activities of these proteins were not severely impaired by the fusion of mV and that the reduced activity of mV-tagged Wnt8 compared to untagged Wnt8 could possibly be due, at least in part, to differences in translation (Figure 1—figure supplement 1). In contrast, we found that only the secreted form of mV (sec-mV), which was not expected to bind specifically to the cell surface, was hardly visible along the cell boundary under the same conditions (Figure 1A, right). Since Wnt8 and Frzb colocalize with heparan sulfate clusters on cell surfaces, we speculated that binding to cell surface proteins, like heparan sulfate proteoglycans (HSPGs), affects the distribution of Wnt8 and Frzb. To examine this possibility, we added heparin-binding (HB) peptides, consisting of 16 (ARKKAAKA)2 (HB2) or 32 amino acids (ARKKAAKA)4 (HB4) (Verrecchio et al., 2000; Figure 1C) to sec-mV. Addition of HB peptides significantly increased the intensity of mVenus fluorescence in the intercellular region compared to that of sec-mV. This suggests that the intercellular distribution of secreted proteins depends on interactions with docking molecules on cell surfaces.
Figure 1. Extracellular distributions of Wnt8, Frzb, and artificial secreted proteins.
All images presented were acquired using live-imaging with the photon counting method, which enables saturation-free imaging even with samples having a wide dynamic range. (A) Distribution of secreted proteins in the superficial layer of a living Xenopus gastrula (st. 10.5–11.5). Observed focal planes were at the subapical level, as illustrated. mRNAs for indicated mVenus (mV) fusion proteins were microinjected into a single ventral blastomere of four- or eight-cell stage embryos to observe regions adjacent to the source cells (indicated with asterisks). All images were acquired in the same condition with photon counting detection. Look-up tables (LUT) show the range of the photon counts in the images. (B) Intensity plots for mV-Wnt8 and mV-Frzb in the intercellular space. Plots along the arrows in enlarged pictures in (A) are shown. (C) Distribution of artificial secreted proteins in Xenopus embryos. The data of sec-mV is the same as in (A). sec-mV was not apparent in the intercellular space, whereas sec-mV-HB2 and sec-mV-HB4 were distributed in the intercellular space (arrowheads). SP, signal peptide; HB, heparin binding peptide. (D) Quantification of fluorescent intensities in the intercellular space. Photon counts per pixel are presented. All samples show statistically significant differences (p<2e-16, pairwise comparisons using the Wilcoxon rank sum test adjusted for multiple comparison with Holm’s method). Scale bars, 20 μm. Amounts of injected mRNAs (ng/embryo): mV-wnt8, mV-frzb, sp-mV, sp-mV-hb2, or sp-mV-hb4, 0.25.
Figure 1—figure supplement 1. Endogenous-equivalent dose of mV-wnt8 and biological activity of mV-Wnt8 and mV-Frzb.
Figure 1—figure supplement 2. Imaging of secreted mVenus protein in intercellular space.
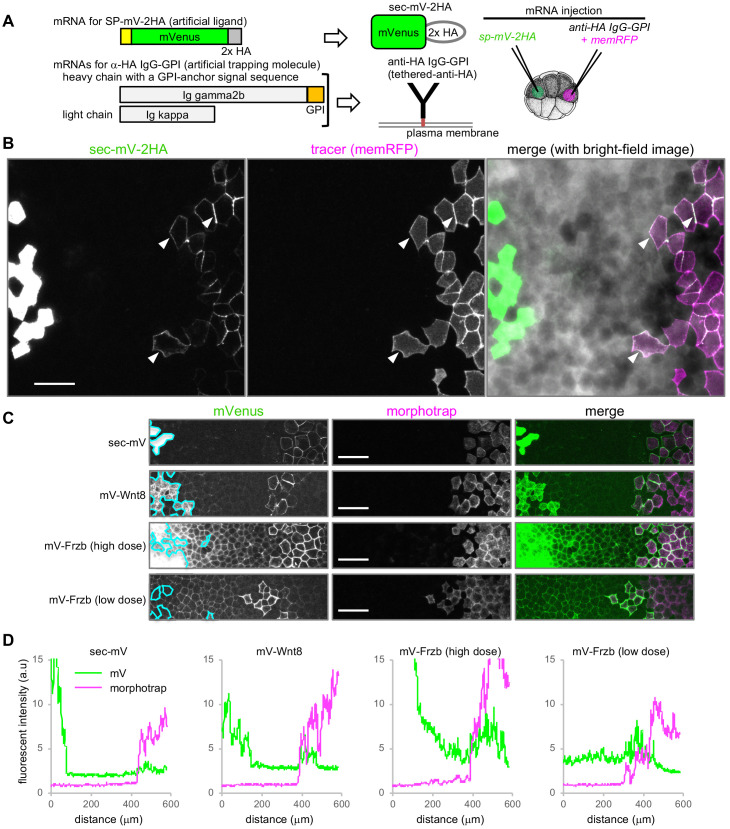
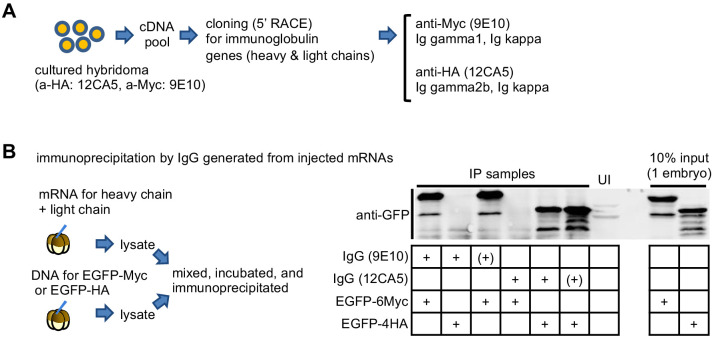
To directly examine this idea, we constructed a reconstitution system, consisting of HA-epitope-tagged secreted mVenus (sec-mV-2HA) and a membrane-tethered anti-HA antibody (‘tethered-anti-HA Ab’) (Figure 2A, see Figure 2—figure supplement 1 for cDNA cloning and validation of anti-HA antibody). This artificial protein and tethered-anti-HA Ab were expressed in separated areas in the animal cap region of Xenopus gastrulae. As with sec-mV, sec-mV-2HA was hardly visible in the intercellular space, even close to the source cells (Figure 2B). In contrast, sec-mV-2HA was observed around tethered-anti-HA Ab-expressing cells that were traced with memRFP, even though these cells were distantly located from the source cells (Figure 2B). Thus, interaction with cell surface proteins can affect distributions of secreted proteins.
Figure 2. Tethered-anti-HA Ab and morphotrap.
(A) Schematic representation of tethered-anti-HA Ab. (B) Results of tethered-anti-HA Ab. The artificial ligand (sec-mV-2HA) was trapped at tethered-anti-HA Ab-expressing cells, distant from the source. The superficial layer of a Xenopus gastrula (st. 11.5) was imaged as a z-stack and its maximum intensity projection (MIP) was presented for the fluorescent images. Intercellular mVenus signal (green) of sec-mV-2HA was not apparent in the vicinity of source cells, but was detected around the tethered-anti-HA Ab-expressing cells (arrowheads) that are traced with memRFP (magenta). (C) Morphotrap at a distant region from the source. The superficial layer of a Xenopus gastrula (st. 11.5) was imaged as a z-stack and its maximum intensity projection (MIP) was presented for the fluorescent images. The intercellular mVenus signal of an artificial ligand, sec-mV (green), was not detected in the vicinity of source cells (green) (left panel), but was detected around the morphotrap-expressing cells that can be traced by mCherry fluorescence (middle panels). Also, mV-Wnt8 and mV-Frzb were trapped and accumulated on distant morphotrap-expressing cells, suggesting the existence of diffusing molecules in the distant region. Source regions are indicated with cyan lines according to memBFP (tracer for mV-tagged proteins, not shown). (D) Distribution of mVenus and morphotrap. Fluorescent intensity of mVenus and mCherry (for morphotrap) was plotted from the left to the right. Scale bars, 100 μm. Amounts of injected mRNAs (ng/embryo) sp-mV-2ha, 1.0; memRFP, 0.15; ig gamma2b-gpi, 1.1; ig kappa, 0.63 (B); sec-mV, mV-wnt8, or mV-frzb (high dose), 0.25; mV-frzb (low dose), 0.063; morphotrap, 1.0; memBFP, 0.1 (C).
Figure 2—figure supplement 1. Generation of functional antibody protein by mRNA-injection into Xenopus embryos.
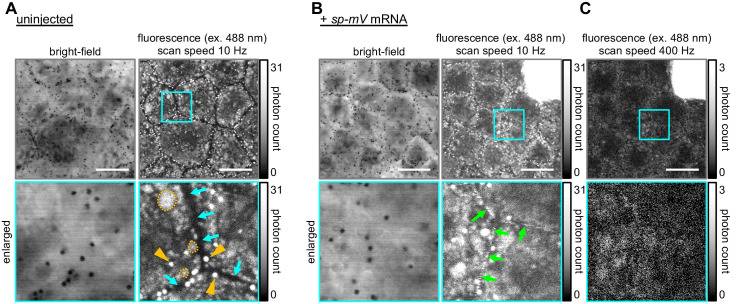
This result also indicates that diffusing proteins are not readily visible using standard confocal microscopy, unless they are trapped by cell surface proteins. In fact, quantitative analysis of artificial secreted proteins revealed a slight, but significant increase of photon counts in the intercellular region by injection of mRNA for sec-mV, compared to uninjected embryos, indicating that sec-mV actually exists in the intercellular region (Figure 1D, Figure 1—figure supplement 2).
Populations of secreted Wnt8 and Frzb proteins disperse long distance
We next examined dispersal of molecules of mV-Wnt8 and mV-Frzb. Both mV-Wnt8 and mV-Frzb accumulated locally along the cell boundary at the subapical level (Figure 1A and B), consistent with previous observations (Mii et al., 2017), which indicated that populations of Wnt8 and Frzb in the intercellular space were bound to the cell surface at HS clusters. On the other hand, given that some molecules of mV-Wnt8 or mV-Frzb may drift away from the cell surface, these proteins would be almost undetectable with standard confocal microscopy, as exemplified by sec-mV (Figure 1A) and tethered-anti-HA Ab (Figure 2B). To examine such mobile proteins, we tried to capture them using ‘morphotrap’ located distantly from the source cells (Figure 2C). Morphotrap is a membrane-tethered form of anti-GFP nanobody, originally devised to block dispersal of Dpp-GFP from source cells (Harmansa et al., 2015). We supposed that morphotraps could be utilized to detect or visualize diffusible proteins, similar to tethered-anti-HA Ab. As expected, sec-mV accumulated on the surface of morphotrap-expressing cells remote from source cells (Figure 2C). Similarly, mV-Wnt8 and mV-Frzb were trapped (Figure 2C), evidencing the long-distance dispersal (over 15 cells/200 μm) of some of secreted mV-Wnt8 and mV-Frzb molecules. These proteins are not likely to be transferred by cell-movement-based mechanisms, including distant migration of source and morphotrap-expressing cells, because cells in the animal cap region form an epithelial sheet and are tightly packed. In addition to this dispersing population, mV-Wnt8 and mV-Frzb were also detectable in gradients from producing cells to morphotrap-expressing cells, unlike the case of sec-mV (Figure 2C and D). These results suggest that populations of mV-tagged Wnt8 and Frzb do not associate tightly with cell surfaces, thereby potentially dispersing far from source cells.
FCS analyses combined with quantitative imaging reveal cell-surface-bound and diffusing Wnt8 and Frzb proteins in the extracellular space
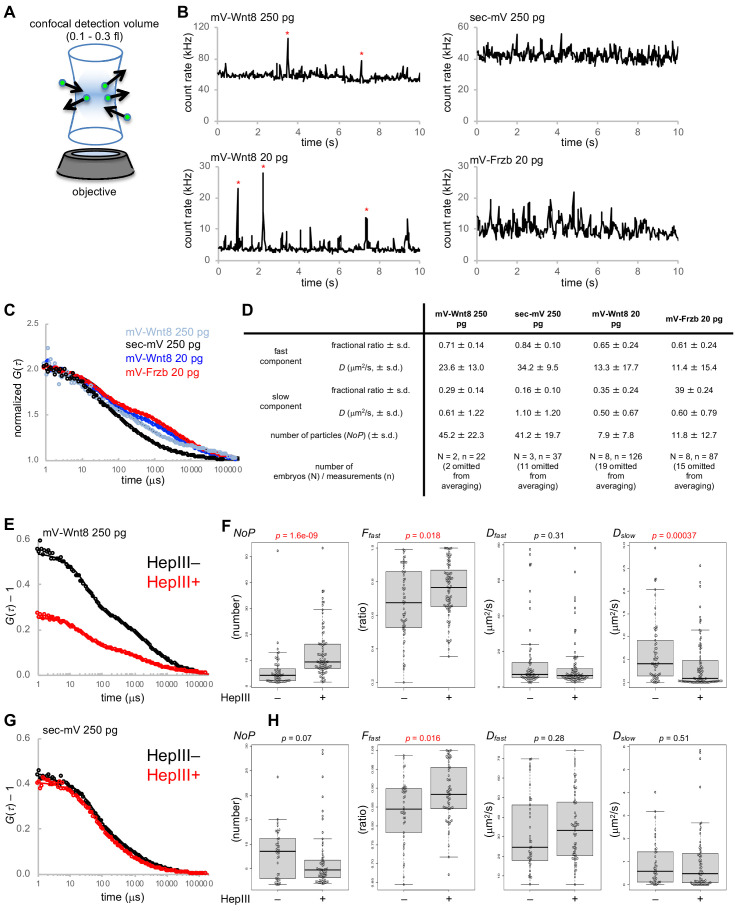
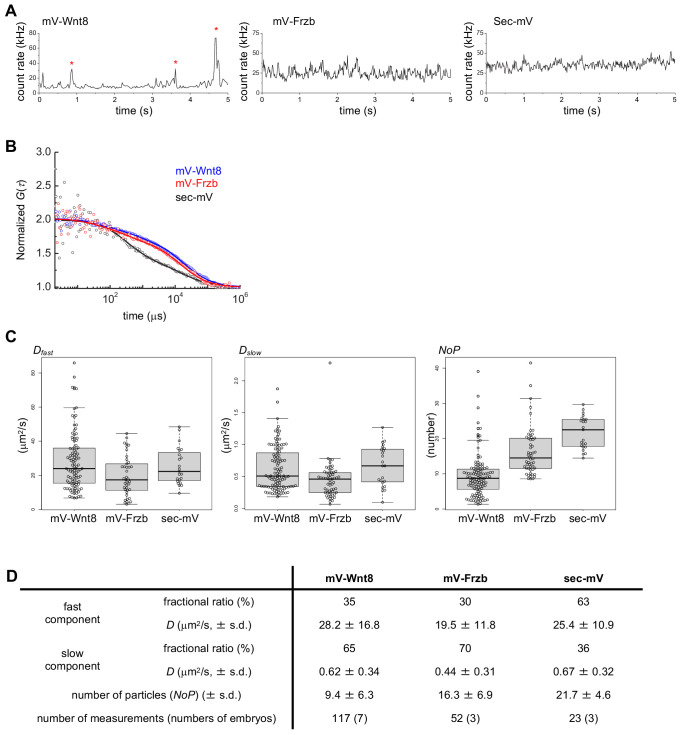
We next attempted to quantify the populations of Wnt8 or Frzb proteins associated with cell surfaces and diffusing in the extracellular space. For this purpose, we employed fluorescence correlation spectroscopy (FCS). FCS analyzes fluctuation of fluorescence by Brownian motion of fluorescent molecules in a sub-femtoliter confocal detection volume (Figure 3, A and B). By autocorrelation analysis (Figure 3C), FCS can measure diffusion coefficients (D) of mobile molecules and the number of particles in the detection volume, but inference of diffusion coefficients depends on mobile molecules (Hess et al., 2002; Fradin, 2017). FCS analyses were performed by injecting the same doses of mV-Wnt8 and sec-mV that were used in the experiments shown in Figure 1 (250 pg mRNA/embryo) to consider the relationship between photon counting from live-imaging and NoP from FCS. Furthermore, to measure the dynamics of mV-Wnt8 and mV-Frzb at a concentration equivalent to the endogenous concentration, a decreased amount of RNA was also injected (20 pg mRNA/embryo, see Figure 1—figure supplement 1A).
Figure 3. Fluorescence correlation spectroscopy (FCS) in the extracellular space of Xenopus embryos.
mRNAs for mV-tagged proteins or sec-mV were injected into the animal pole region of a ventral blastomere of four- or eight-cell stage Xenopus embryo. Injected embryos were observed at gastrula stages (st. 10.5–11.5). Each FCS measurement (10 s) was performed at a point in the intercellular region within three cell diameters of the source cells. (A) Schematic illustration of FCS measurement. In FCS measurements, the fluorescent signal usually fluctuates due to Brownian motion of fluorescent molecules. Such fluctuations contain dynamic properties of fluorescent molecules. Briefly, temporal frequency of the fluctuations corresponds to the diffusion coefficient (D) and amplitude of the fluctuations corresponds inversely to the number of particles in the confocal detection volume (0.3 fl with Leica system; 0.12 fl with Zeiss system). (B) Trace of fluorescent intensities in a single measurement of indicated conditions. mV-Wnt8 shows characteristic peaks, probably corresponding to multimeric forms (asterisks, Takada et al., 2018). (C) Normalized autocorrelation curves of averaged data. Numbers of embryos/measurements are as indicated in (D). Experimental data are plotted with circles with the best fitting curve. (D) Summary of FCS measurements. Mean values are presented. s.d., standard deviation. Indicated numbers of measurements were omitted for averaging (in the table, no data were omitted for C), based on Dfast values over 80 μm2/s (reflecting blinking of mVenus). (E–H) Effect of HS digestion by HepIII-GPI on mV-Wnt8 or sec-mV. Measurements were performed in the same embryos to achieve side-by-side comparison at control regions (HepIII–) or HS-digested regions (HepIII+). (E, G) Unnormalized autocorrelation curves of averaged data (number of embryos: (E) 3, (G) 4; number of measurements: (E) HepIII–, 84 HepIII+, 97; (G) HepIII–, 56 HepIII+, 87). (F) Measured parameters obtained by curve-fitting. Statistical significance (p, indicated in red, when significant) was calculated using the Wilcoxon rank sum test. Numbers of omitted measurements due to unreliable parameters (Dfast values over 80 μm2/s; inadequate Ffast values due to virtually the same Dfast and Dslow values): (F) HepIII–, 24;2 HepIII+, 10;3 (H) HepIII–, 17;1, HepIII+, 21;5. Lyn-mTagBFP2 and/or Lyn-miRFP703 were used to trace source cells, control regions, or HepIII +regions. Fluorescence of these tracers did not interfere with FCS measurements because these can be completely separated from mVenus. Amounts of injected mRNAs (pg/embryo): mV-wnt8, 250 or 20; mV-frzb, 20; sec-mV, 250; sp-hepIII-ha-gpi, 400; lyn-mTagBFP2, 100; lyn-miRFP703, 200.
Figure 3—figure supplement 1. Supplementary data for FCS analysis.
Figure 3—figure supplement 2. FCS analysis with another system (Zeiss ConfoCor2).
Figure 3—figure supplement 3. Membrane-tethered form of Heparinase III (HepIII-HA-GPI) digests HS chains on expressing cells.
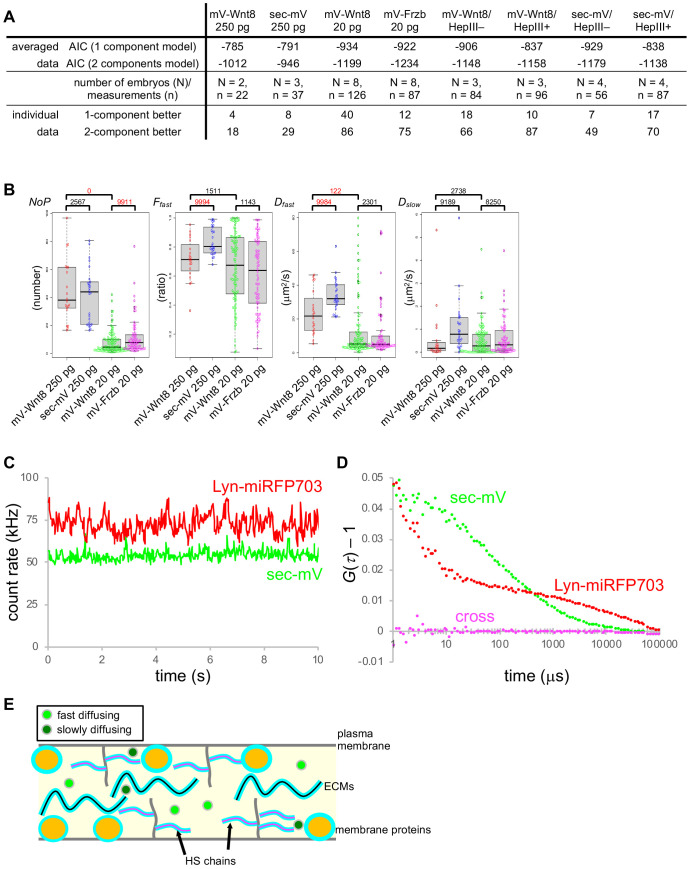
To analyze the data obtained by FCS measurements, we compared the suitability of one-component and two-component diffusion models using the Akaike information criterion (AIC) (Tsutsumi et al., 2016). AIC supported fitting with the two-component model, comprising fast and slow diffusing components (Figure 3—figure supplement 1A). Consistent with predictions, the result indicated that the number of particles (NoP) of mV-Wnt8 (250 pg/embryo) was significantly higher than that of mV-Wnt8 (20 pg/embryo, endogenous-equivalent level; Figure 3D and Figure 3—figure supplement 1B). Mean values of Dfast indicate that fast-diffusing components in all groups examined can be regarded as free diffusion (Figure 3D), because theoretical, as well as reported D values of freely diffusing proteins of similar size, range from 10 to 100 μm2/s (Pack et al., 2006; Yu et al., 2009; Zhou et al., 2012). Importantly, even at the endogenous-equivalent level, mV-Wnt8 and mV-Frzb show freely diffusing populations (Dfast >10 μm2/s, Figure 3—figure supplement 1B). We also note that the diffusion coefficient of the fast component of mV-Wnt8 (20 pg/embryo, endogenous-equivalent level) was significantly lower than that of mV-Wnt8 (250 pg/embryo), suggesting stronger constraints with the endogenous-equivalent expression level. Thus, we conclude that within the small volume of FCS measurements, a population of mV-Wnt8 and mV-Frzb molecules diffuses freely under physiological conditions.
As shown in Figure 1D, photon counts of mV-Wnt8 were much higher than those of sec-mV. However, under the same conditions as in Figure 1 (250 pg mRNA/embryo), NoP of mV-Wnt8 was similar to that of sec-mV (Figure 3—figure supplement 1B) or even smaller in another set of measurements (Figure 3—figure supplement 2). Thus, molecules detected in FCS appear not to contribute to the photon counts in the confocal imaging under these conditions. We speculate that FCS measurements might be biased to choose positions where HS-bound molecules are not abundant. Otherwise, HS-bound, immobile molecules cause strong photobleaching, which results in large drift of the fluorescence intensity. In general, such a data is not suitable for analysis.
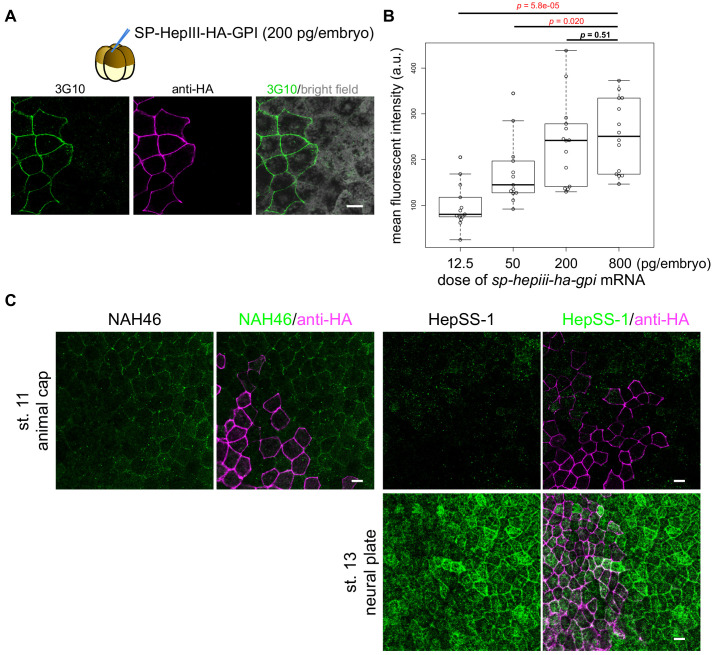
Interestingly, slow components were observed not only in mV-Wnt8, but also in sec-mV (Figure 3D). To characterize these slow components, we examined the effects of HS-chain digestion with FCS. These analyses were performed with embryos injected with 250 pg/embryo RNA for mV-Wnt8 or sec-mV, because at the endogenous-equivalent level, measured values showed a large variance, possibly reflecting heterogeneity of the extracellular space, and also signal detection was difficult for sec-mV. For this purpose, we made a membrane-tethered form of Heparinase III (HepIII-HA-GPI, also known as heparitinase I) (Hashimoto et al., 2014). HepIII-HA-GPI enables us to digest HS chains in a region of interest (Figure 3—figure supplement 3), allowing us to examine the effects of HS-digestion in the same embryos. For mV-Wnt8, NoP and the fraction of fast components, Ffast was significantly increased by HepIII, suggesting release of mV-Wnt8 from HS chains (Figure 3E and F). Thus, we suggest that HS chains contribute to the slow components of mV-Wnt8. For sec-mV, although NoP was not significantly changed by HepIII, Ffast was slightly, but significantly increased by HepIII (Figure 3G and H). Furthermore, fluorescence cross-correlation spectroscopy (FCCS) analysis indicated that sec-mV did not interact with the cell membrane (Figure 3—figure supplement 1C and D). Thus, HS-chains showed some contribution to the slow components of sec-mV even without interaction. We speculate that such a slow population of sec-mV could be explained by hindered diffusion, in which torturous diffusion results from HS chains and other ECMs, because HS chains are highly hydrophilic and well hydrated (Figure 3—figure supplement 1E).
FDAP analyses suggest exchange of cell-surface-bound and unbound states of Wnt8 and Frzb proteins
Although FCS analysis is suitable for measuring diffusing molecules, it cannot directly analyze molecules with extremely low mobility (Hess et al., 2002). To directly analyze dynamics of such molecules, we next employed fluorescence decay after photostimulation/photoconversion (FDAP) assays (Matsuda et al., 2008; Müller et al., 2012) in the intercellular space of Xenopus embryos.
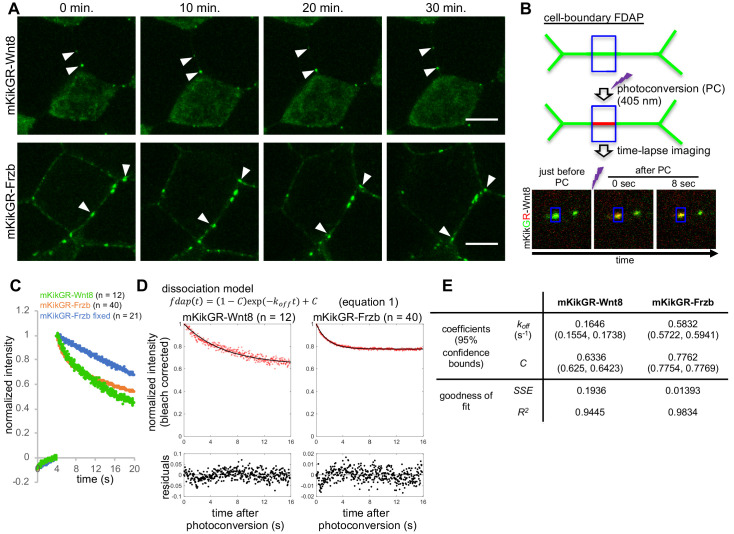
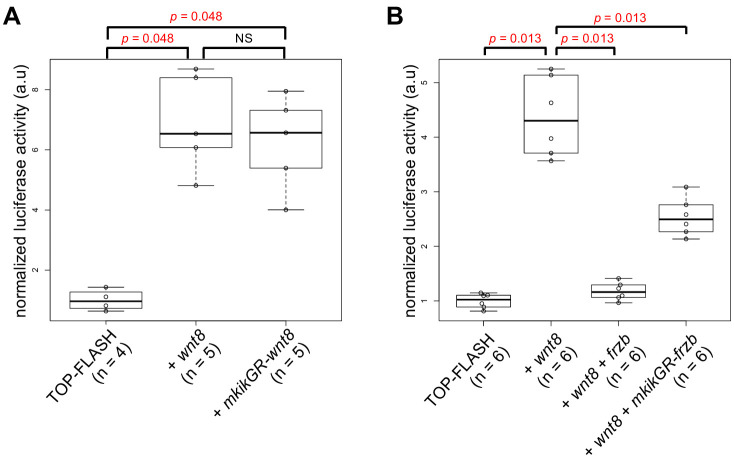
Since FRAP/FDAP measurements usually examine considerably larger regions (typically containing tens or hundreds of cells) than with FCS (Rogers and Schier, 2011), direct comparisons of dynamics between FRAP/FDAP and FCS may need careful consideration. Therefore, we restricted the area of photoconversion to a diameter of 1.66 μm and reduced the measurement time (16 s), allowing us to obtain dynamic data in the intercellular region under conditions comparable to those for FCS (Figure 4A). We refer to this FDAP mode as ‘cell-boundary FDAP.’ In this analysis, we fused a photoconvertible fluorescent protein, mKikGR (mK) (Habuchi et al., 2008) to Wnt8 and Frzb (mK-Wnt8 and mK-Frzb). These fusion proteins showed distributions in embryos similar to mV-tagged proteins (Figure 4A), and retained biological activities (Figure 4—figure supplement 1). Importantly, observed distribution patterns of mK-Wnt8 and mK-Frzb were stable for up to tens of minutes (Figure 4A). Therefore, we assumed a steady state during the FDAP analysis (16 s).
Figure 4. Fluorescence decay after photoconversion (FDAP) assay at the cell-boundary of Xenopus embryos.
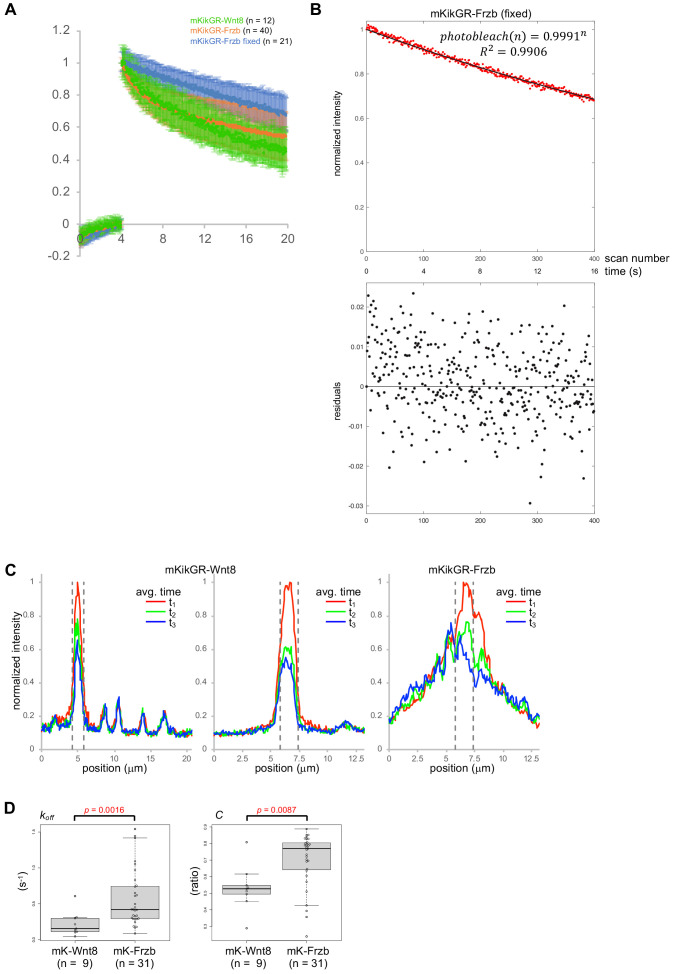
(A) Stable distribution of mKikGR-Wnt8 and mKikGR-Frzb. The superficial layer of a Xenopus gastrula (st. 10.5–11) was imaged as a z-stack and maximum intensity projection (MIP) was presented. Puncta of these proteins persisted for 30 min (arrowheads). Scale bars, 10 μm. (B) Schematic illustration of cell-boundary FDAP assay. Green lines represent mKikGR-fusion protein distributed in the intercellular region. As an example, still images before and after photoconversion (PC) are shown. Width of the blue box (area of PC and measurement) was 1.66 μm. See also Videos 1–3 and the text for detail. (C) Time course of red (photoconverted state) fluorescent intensity within the photoconverted region. Photoconversion was performed about 4 s after the beginning of the measurement. Means of normalized intensities were presented (for s.d., see Figure supplement 2A). Data of ‘mKikGR-Frzb fixed’ were measured with MEMFA-fixed mKikGR-Frzb expressing embryos as an immobilized control. Numbers of measurements were indicated as n, which were collected in multiple experiments (twice for mKikGR-Wnt8 and mKikGR-Frzb fixed, and four times for mKikGR-Frzb). (D) Fluorescent decay curves fitted with the dissociation model. The mean of normalized intensities for each time point was corrected for photobleaching with division by 0.9991n (n, number of scanning after PC; Figure 4—figure supplement 2B). Fitting curves are shown as black lines. Residuals were mostly within 5% (0.05) and within 10% (0.1) in all cases. (E) Coefficients and evaluation of goodness of fit with the dissociation model. koff, off-rate constant; C, rate of immobile component; SSE, sum of squared errors; R2, coefficient of determination. Amounts of injected mRNAs (ng/embryo): mkikGR-wnt8 and mkikGR-frzb, 4.0.
Figure 4—figure supplement 1. Biological activity of mKikGR-Wnt8 and -Frzb.
Figure 4—figure supplement 2. Fluorescence decay after a photoconversion (FDAP) assay in the extracellular space of Xenopus embryos.
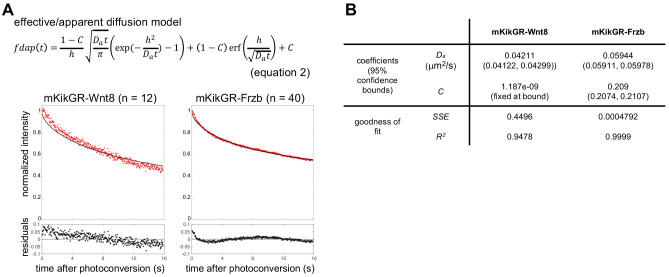
Figure 4—figure supplement 3. Fluorescent decay curve fitted with the effective diffusion model.
After photoconversion, red fluorescent intensity of mK-tagged proteins was measured in the same rectangular area as photoconversion (Figure 4B). Because puncta of Wnt8 are often internalized with HS clusters (Mii et al., 2017), we excluded data in which vesicular incorporation was observed during measurement of mK-Wnt8. As an immobilized control, mK-Frzb in formaldehyde-fixed embryos was similarly photoconverted. Its intensity within the rectangular region was fitted to the photobleaching model using repeated laser scanning, confirming that it actually was immobilized by formaldehyde fixation (Figure 4—figure supplement 2B). Compared with this fixed control, mK-Wnt8 and mK-Frzb showed faster decline of fluorescent intensities (Figure 4C and Figure 4—figure supplement 2A), confirming that a population of mK-Wnt8 and mK-Frzb moved away from the photoconverted area.
Given that the punctate distribution of mK-Wnt8 and -Frzb results from their binding to HS clusters (Mii et al., 2017), we considered whether a simple dissociation model (Equation 1) is suitable for curve-fitting of FDAP data. Indeed, bleaching-corrected FDAP curves of mK-Wnt8 and mK-Frzb were well fitted to this model (Figure 4D; residuals were mostly within 5% and all within 10%) with the indicated parameters (Figure 4E, the off-rate constant koff, and the rate of the constantly bound component C; for individual data plot, see Figure 4—figure supplement 2D). As a result, both mK-Wnt8 and mK-Frzb show large C values, indicating that the majority of these proteins can be considered immobile on the timescale of the measurement (Figure 4E). In addition, koff of mK-Wnt8 was significantly lower than that of mK-Frzb (Figure 4—figure supplement 2D), suggesting relatively rapid dissociation of mK-Frzb from the binding site. This difference appears to be consistent with FDAP spatial intensity profiles, in which photoconverted mK-Frzb, but not mK-Wnt8, accumulated in adjacent areas (Figure 4—figure supplement 2C, see also Videos 1, 2 and 3). Thus, we conclude that most mK-Wnt8 and mK-Frzb molecules are bound, but can be exchanged with unbound molecules, and also dissociation rate values of mK-Wnt8 and mK-Frzb differ significantly.
Video 1. Photoconversion of mKikGR-Wnt8 in a cell-boundary region of a Xenopus embryo.
Video 2. Photoconversion of mKikGR-Wnt8 in a cell-boundary region of a Xenopus embryo (another example).
Video 3. Photoconversion of mKikGR-Frzb in a cell-boundary region of a Xenopus embryo.
Photoconversion of mKikGR fusion proteins was performed at a cell-boundary region in the animal cap of a Xenopus gastrula (st. 10.5 st.11.5). mKikGR-Wnt8 (Videos 1 and 2) or mKikGR-Frzb (Video 3) was photoconverted at the region indicated with the blue box after 100 frames scanned (about 4 s), and another 400 frames were scanned for measurement. The width of the region for photoconversion and intensity measurement was 20 pixels (1.66 μm). The play speed is x1.
Mathematically modeling diffusion and distribution of secreted proteins
Based on our quantitative imaging (Figure 1) of tethered-anti-HA Ab and morphotrap (Figure 2) FCS (Figure 3) and FDAP (Figure 4), we conclude that most Wnt8 and Frzb molecules are bound to cell surfaces, while small numbers of freely diffusing molecules exist in the extracellular space. Furthermore, we have already shown that Wnt8 and Frzb utilize different types of HS clusters, N-sulfo-rich and N-acetyl-rich, as cell-surface scaffolds, respectively (Mii et al., 2017). Thus, we examined whether free diffusion and binding to HS clusters can explain the extracellular distribution or gradient formation of secreted proteins, using mathematical modeling.
Here, we consider two states of ligands: free and bound. The free state corresponds to the fast diffusing component in FCS, and we consider the bound component as immobile molecules. This model includes five dynamic processes: (i) ligand production, (ii) diffusion of free molecules in intercellular space, (iii) binding of ligands to HS clusters on cell surfaces, (iv) release of bound molecules from HS clusters and (v) internalization of bound molecules into cells. In one-dimensional space, the model is written as:
| (1) |
| (2) |
where u and v represent the concentration of free molecules and numbers of bound molecules, respectively, of a secreted protein. The symbols x and t are position and time, respectively. The symbols a(x), b, c, and g(x) represent binding, release, internalization, and production rates, respectively (Figure 5A); a(x) is equivalent to the amount of HS in HS clusters (for details, see Materials and methods). D (= 20 μm2/s) represents the diffusion coefficient of the free component in the extracellular space, which corresponds to the fast diffusing component measured by FCS (Figure 3D).
Figure 5. A minimal model of secreted protein dynamics in the extracellular space.
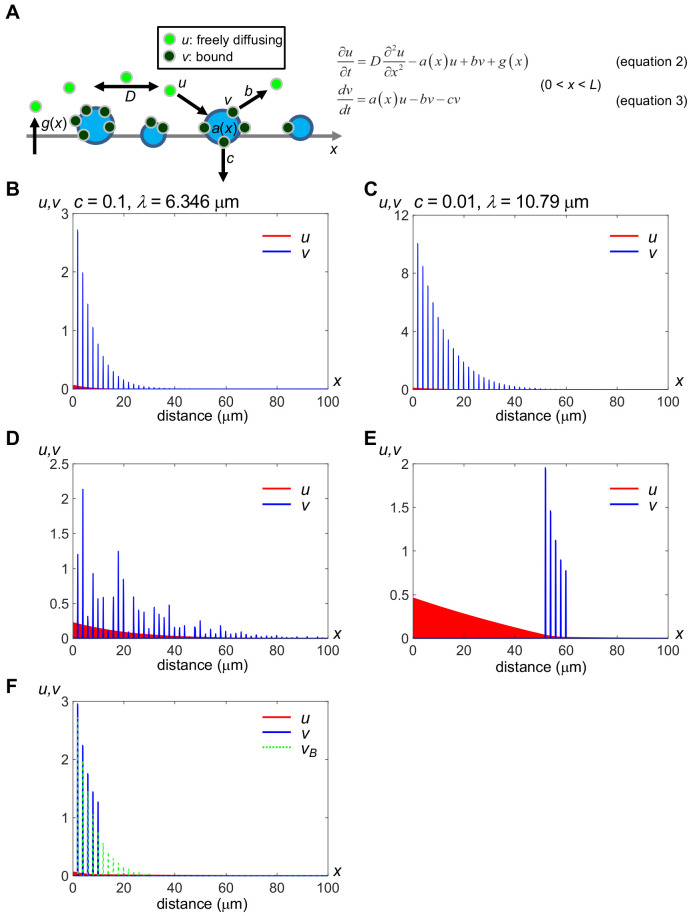
Distributions of free (u) and bound (v) components of secreted proteins were obtained by computer simulation. The vertical axis indicates the amount of u and v, and the horizontal axis indicates the distance (x); Distributions in the range of 0 ≤ x ≤ 100 (μm) are shown while the model considers a field whose spatial length L = 1000 (μm). Distributions of u (red) and bound v (blue) at time t = 100 (sec) are shown, which we confirmed as being nearly steady states. We used the forward difference method with spatial step Δx = 0.1 and temporal step Δt = 0.0001 in numerical calculations. The level of v at the position where docking sites exist (a(x) = an,max) remains relatively high even after an,max exceeded b. (A) Schema of the modeling. a(x), binding rate at position x. Note that a(x) is equivalent to the amount of HS for an HS cluster. b, release rate from the HS clusters. c, internalization rate of the HS clusters. D, diffusion coefficient of u. g(x), production rate at position x. For details, see Materials and methods. (B) Rapid internalization of the docking sites. Parameter values are: D = 20.0 (μm2/s), an,max = 10.0, b = 0.1, c = 0.1, gmax = 0.2, R = L/1000, p1 = 2, and p2 = 0.2. The decay length λ is calculated as 6.346 μm, according to the fitting curve (see Figure 5—figure supplement 1A). See also Source code 1. (C) Slow internalization of the docking sites. Parameter values are the same as in (A) except for c = 0.01. The decay length λ is calculated as 10.79 μm, according to the fitting curve (see Figure 5—figure supplement 1B). This value represents a wider range than that in (A). See also Source code 2. (D) Local accumulation similar to intercellular distribution of mV-Wnt8 and -Frzb. an,max is given randomly for each n by an absolute value of the normal distribution. See also Source code 3. (E) Distant scaffolds from the source region. an,max is given to depend on space: 10.0 for 50 ≤ x ≤ 60, otherwise, an,max is 0.0. This situation is similar to tethered-anti-HA Ab (Figure 2B). See also Source code 4. (F) Ligand accumulation in front of the HS-absent region. an,max is given depending on space: 10.0 for 0 ≤ x ≤ 10 and 0 for 10 < x ≤ 1000. Values of v in (B) (vB) are also shown with green dashed lines, for comparison. Note that ligand accumulation occurs in front of the HS-absent region (10 < x.). See also Source code 5.
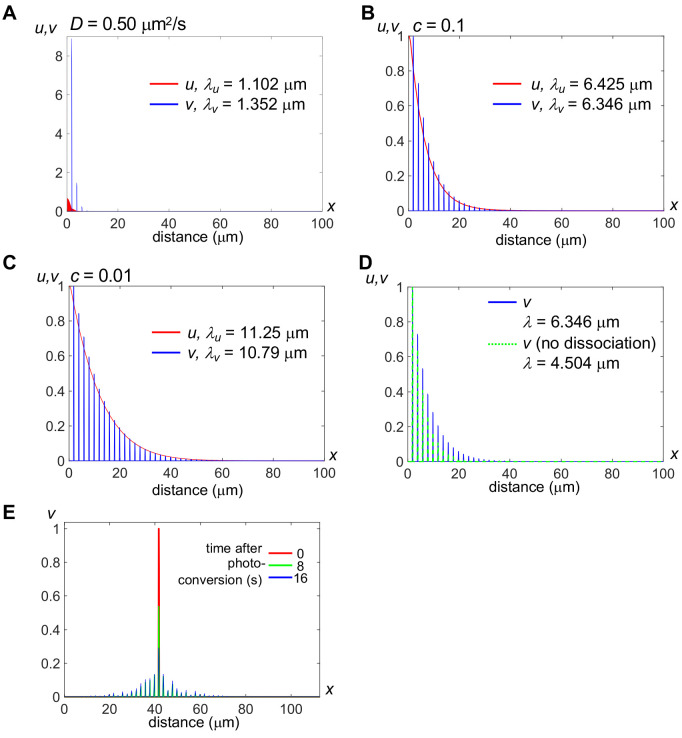
Figure 5—figure supplement 1. Distribution ranges of the ligands in some conditions.
Under a wide range of appropriate parameter values, distributions of u and v converged to steady states within a few minutes. Compared to the fast diffusing component (Figure 5B), the contribution of the slow component (D = 0.50 μm2/s) to the distribution range is much smaller (Figure 5—figure supplement 1A). Hense, we mainly consider the fast component observed in FCS (Figure 3D), as the diffusing population in the model. The free component, u, quickly decreases, displaying a shallow continuous distribution pattern due to diffusion. In contrast, the bound component, v, shows a discrete distribution following a(x), and the level of v is much higher than u at any position, reflecting our conclusion that the majority of Wnt or sFRPs molecules in the extracellular space are bound. Given that activation of Wnt signaling requires internalization of the ligands (Kikuchi et al., 2009; Yamamoto et al., 2006) of the bound component, corresponding to cv in Equation 4, the distribution of the bound component in this model could be equivalent to the ‘actual’ gradient of Wnt signaling, even though it is not diffusing. We demonstrated that consistently some portion of Wnt8 ligands accumulated on N-sulfo-rich HS clusters initiate canonical Wnt signaling by forming the signaling complex ‘signalosome’ (Mii et al., 2017).
We have shown that N-sulfo-rich HS, but not N-acetyl-rich clusters, are frequently endocytosed (Mii et al., 2017). In this model, different internalization rates of N-acetyl-rich and N-sulfo-rich HS clusters can be reflected by varying the internalization rate of the docking sites, c. A smaller value of c results in long-range distribution (compare Figure 5B and C), explaining why Frzb shows a long-range distribution by binding to N-acetyl-rich HS clusters (Mii et al., 2017). We can evaluate the distribution by the decay length, λ. λ represents a distribution range when the steady state gradient is written as
| (5) |
(Kicheva et al., 2012; Kicheva et al., 2007). We calculated λ by curve-fitting the peak values of v to Equation 5. The value of λ with c = 0.1 or 0.01 is 6.346 or 10.79 μm (Figure 5B,C and Figure 5—figure supplement 1B,C for normalized plots), respectively, showing that internalization rates of HS clusters can affect distribution ranges, as observed between Wnt and sFRPs (Mii and Taira, 2009). In addition, we examined the contribution of dissociation from the bound to the diffusing state, suggested by our cell-boundary FDAP (Figure 4). Without dissociation, a shorter range distribution of the bound component was obtained (λ = 4.504 μm, Figure 5—figure supplement 1D) than with dissociation (λ = 6.346 μm, same data as in Figure 5B). Furthermore, in Xenopus embryos, Wnt8 in the intercellular space exhibited local accumulations (Figure 1B). In our model, when the binding rate an,max (Equation 7 in the Materials and methods) fluctuates randomly (i.e. the amount of HS at position x), the bound ligand component also fluctuates (Figure 5D, blue), reproducing the local accumulation of Wnt8 and Frzb in Xenopus embryos. Even under these conditions, the free component shows a continuously decreasing gradient (Figure 5D, red), which probably corresponds to the FCS-measured, diffusing component of the FGF8 gradient in zebrafish embryos (Yu et al., 2009; measuring concentrations by FCS in a wide field is technically difficult in larger Xenopus embryos). Thus, our mathematical model can generalize protein distributions in the extracellular space.
Discussion
As one of the major secreted signaling molecules, mechanisms of Wnt dispersal are crucial when we consider embryonic patterning and various other systems involving Wnt signaling (Routledge and Scholpp, 2019). Among many Wnt proteins, Wg distribution in the Drosophila wing disc has long been investigated as a morphogen gradient (Strigini and Cohen, 2000; Zecca et al., 1996). Various genetic studies show that the extracellular distribution of Wg largely depends on HSPGs, such as Dally and Dally-like glypicans (Baeg et al., 2004; Franch-Marro et al., 2005; Han et al., 2005). Furthermore, FRAP-based analysis suggests that the effective diffusion coefficient of Wg is much slower (0.05 μm2/s) than free diffusion (>10 μm2/s) (Kicheva et al., 2007). However, such dynamics of secreted signaling proteins still remain a matter of debate (Rogers and Schier, 2011). On the other hand, recently we found that HS chains on the cell surface are organized in clusters with varying degrees of N-sulfo modification in Xenopus embryos and HeLa cells. Furthermore, we demonstrated that endogenous Wnt8 protein visualized by immunostaining shows a punctate distribution, specifically associated with N-sulfo-rich HS clusters (Mii et al., 2017). Similar punctate distributions have also been observed with Wg in Drosophila (Strigini and Cohen, 2000; van den Heuvel et al., 1989), but the significance of these distributions has not yet been explained. Therefore, to gain insight into the mechanism of Wnt distribution, we examined Wnt8 protein dynamics.
Based on quantitative live-imaging techniques, we propose that most Wnt8 molecules distributed among cells are mostly cell-surface-bound, while a small portion of them are diffusing. Similarly, Wnt/EGL-20 shows that puncta mostly overlap with Frizzled and a small population of mobile/diffusing molecules is also suggested in C. elegans (Pani and Goldstein, 2018). In Xenopus embryos, Frizzled may also contribute to bind Wnt ligands because some Wnt8 puncta overlapped with Frizzled8 (Mii et al., 2017). Furthermore, a small population of diffusing Dpp has been shown in Drosophila wing disc (Zhou et al., 2012). Importantly, it has been suggested that these populations disperse over long distances, similar to our observation of mV-Wnt8 trapped using morphotrap (Figure 2C,D), generalizing the existence of long-dispersing populations in various model systems.
It is plausible that cell-surface-bound Wnt8 is mostly associated with HS clusters (Mii et al., 2017). The function of HSPGs in Wnt dispersal has been examined by genetic studies of Drosophila. These studies show that HSPGs are required for accumulation and transfer of Wnt ligands. Based on these results, it has been proposed that Wnt disperses by restricted diffusion, in which HSPGs transfer Wnt ligands in a bucket brigade manner (Yan and Lin, 2009). In our FDAP assay, most photoconverted mK-Wnt8 does not diffuse laterally, even when other puncta of Wnt8 exist near the site of photoconversion (Figure 4—figure supplement 2C, left panel, Video 1). We further considered this observation with modeling (Figure 5—figure supplement 1E). Unlike the experiment, modeling shows lateral dispersal of photoconverted molecules in neighboring regions, over time. For this difference, we mainly consider two possibilities: (i) Our imaging system may not be sufficiently sensitive to detect such a small increase, or the increase of the ligands may be obliterated by photobleaching. (ii) If binding dynamics of mK-Wnt8 are slower than in our model, ligands may diffuse away before re-binding in neighboring regions. On the other hand, mK-Frzb showed some lateral dispersal similar to the model. As previously discussed, these behaviors in FRAP experiments can be classified into some cases including ‘reaction dominant’ and ‘effective diffusion’ by a balance among the on-rate, the off-rate, and the diffusion coefficient (Sprague and McNally, 2005; Sprague et al., 2004). Restricted diffusion can be understood as a kind of effective diffusion in which dynamics of ligand binding/dissociation to HSPGs are similar to those of free diffusion. Although we did not derive binding constants, at least superficially, mK-Frzb showed an effective diffusion-like behavior, whereas mK-Wnt8 showed a reaction dominant-like behavior, in which free diffusion is much faster than binding/dissociation. In order to compare our data with those previously reported (Kicheva et al., 2012), we also performed curve-fitting with an effective/apparent diffusion model (Figure 4—figure supplement 3, Equation 2). As a result, the apparent diffusion coefficient Da (μm2/s) was calculated as 0.042 and 0.059 for mKikGR-Wnt8 and mKikGR-Frzb, respectively. These values are very close to a previously reported FRAP value for Wg (0.05 μm2/s) (Kicheva et al., 2007). Thus, such small values of Da relative to free diffusion could be interpreted as the result of interaction with cell surfaces, regardless of whether the protein of interest actually shows lateral diffusion in bucket brigade fashion.
We found that sec-mV is almost invisible with standard confocal microscopy (Figure 1B). Furthermore, binding to cell surface molecules such as HSPGs and membrane-tethered antibody was sufficient for visible distribution for artificial secreted proteins (Figures 1C and 2B). These findings are similar to recent demonstrations that secreted GFP can be synthetic morphogens with specific scaffold molecules in the Drosophila wing disc (Stapornwongkul et al., 2020) and in cultured cells (Toda et al., 2020). On the other hand, secreted GFP appears visible in some tissues, such as deep cells in early zebrafish embryos (Yu et al., 2009) and developing zebrafish brain (Veerapathiran et al., 2020). In the zebrafish brain, secreted EGFP did not show slow components (Veerapathiran et al., 2020), which is different from our observation in the Xenopus animal cap region (Figure 3D). Together, considering detection of diffusing molecules (Appendix), we speculate that these differences may reflect narrowness of the extracellular space in the tissues.
Our cell-boundary FDAP suggests that cell-surface-bound and diffusing populations are probably exchangeable. Although this result can be explained by dissociation of molecules from the bound state as described above, it also seems possible that endocytosis reduces the number of photoconverted molecules (Figure 4C). However, we consider this less likely. Endocytosis of Wnt8 is possibly mediated by caveolin (Mii et al., 2017; Yamamoto et al., 2006), and we have already shown that internalized Wnt8 was detected as puncta in the cell (Mii et al., 2017). However, in FDAP analyses in this study, we excluded observations with internalization of Wnt puncta from curve-fitting analysis. In our mathematical model, when dissociation from the cell-surface does not occur (b = 0 in Equation 3 and 4, Figure 5A), the range of the gradient (decay length, λ) was shortened from 6.35 to 4.50 μm (Figure 5—figure supplement 1D). Thus, at least in cases we analyzed, dissociation from the bound state seems to contribute to the long-range distribution and rapid formation of the gradient.
A goal of this study is to link quantitative measurements of local protein dynamics to larger spatiotemporal patterns of extracellular protein dispersal in embryos. We hypothesized that local dynamics of diffusion and interaction with HS chains measured by FCS and FDAP could be extrapolated to explain mechanisms for gradient formation across many cells. We mainly consider protein dispersal within a single plain, and this is exemplified in the animal cap region since mV-Wnt8 and mV-Frzb accumulated on the proximal side (to the source) of morphotrap-expressing cells (Figure 2C). But when we consider dispersal of secreted proteins in embryos, other routes can be involved. For example, a BMP antagonist, Chordin exhibits dispersal within the Brachet cleft, which is a fibronectin-rich ECM (Plouhinec et al., 2013). In addition, several other mechanisms, such as cell lineage-based dilution (Farin et al., 2016) and cytonemes/signaling filopodia (Roy et al., 2011; Stanganello et al., 2015) may contribute to dispersal of a morphogen. We emphasize that immobilization of morphogen molecules is a prerequisite for cytoneme/filopodium-mediated transfer of signaling. Gradient formation over long ranges has not been examined experimentally in this study. However, we attempted to understand the outcome of diffusion and binding, basic properties of morphogens. Thus, we propose a mathematical model consisting of free and bound components of Wnt based on observed local dynamics (Figure 5A). This model can be widely applied to secreted proteins that bind to cell surfaces, including sFRPs and other peptide growth factors. Notably, in our mathematical model, distributions of both free and bound components converged to steady states within a few minutes, showing rather fast dynamics in the context of embryonic patterning. This characteristic could solve perceived weaknesses of diffusion-base models (Müller et al., 2013), especially dilemmas related to the speed and stability of gradient formation. From this point of view, the combination of abundant cell-surface-bound and minimal diffusing populations would be beneficial for signaling stability and speed of pattern formation, respectively. Like tethered-anti-HA Ab (Figure 2B), atypical distributions of FGF (Shimokawa et al., 2011) and Nodal (Marjoram and Wright, 2011), in which ligands accumulate in locations distant from their sources, have been reported, although a theoretical explanation of these atypical distributions has proven elusive. In our model, atypical distributions can be reproduced if specific scaffolds for ligands (ligand binding proteins) are anchored on the surfaces of cells (Figure 5E). Furthermore, our model explains the puzzling localization of ligands in tissues. In mosaic analyses of the wing discs of Drosophila mutants, Hh and Dpp ligands accumulate at the edges of clones defective in HS synthesis (Takei et al., 2004; Yan and Lin, 2009). Distributional patterns of these ligands are explained by our model, which accounts for accumulations of ligand in regions lacking HS (Figure 5F). Thus, our model provides a basic framework to understand of the extracellular behavior of secreted proteins.
Materials and methods
Key resources table.
| Reagent type (species) or resource |
Designation | Source or reference | Identifiers | Additional information |
|---|---|---|---|---|
| Antibody | HepSS-1 (mouse monoclonal, IgM) |
Kure and Yoshie, 1986
Mii et al., 2017 |
1:400 Figure 3—figure supplement 3C |
|
| Antibody | NAH46 (mouse monoclonal, IgM) |
Suzuki et al., 2008
Mii et al., 2017 |
1:50 Figure 3—figure supplement 3C |
|
| Antibody | F69-3G10 (mouse monoclonal, IgG2b) | Seikagaku Corp. | 370260 | 1:200 Figure 3—figure supplement 3AB |
| Antibody | Anti-HA (rabbit polyclonal) | MBL | #561 | 1:200 Figure 3—figure supplement 3ABC |
| Antibody | Anti-Wnt8 (rabbit antiserum) | Mii et al., 2017 | 1:4000 Figure 1—figure supplement 1A |
|
| Antibody | Anti-mouse IgG-AlexaFluor 488 (goat polyclonal) | Invitrogen | A11029 | 1:500 Figure 3—figure supplement 3AB |
| Antibody | Anti-rabbit IgG-AlexaFluor 555 (goat polyclonal) | Invitrogen | A21434 | 1:500 Figure 3—figure supplement 3AB |
| Antibody | Anti-rabbit IgG-AlexaFluor 568 (goat polyclonal) | Invitrogen | A11011 | 1:500 Figure 3—figure supplement 3C |
| Antibody | Anti-mouse IgM-AlexaFluor 488 (goat polyclonal) | Invitrogen | A21042 | 1:500 Figure 3—figure supplement 3C |
| Antibody | Anti-rabbit IgG-AlexaFluor 647 (donkey polyclonal) | Invitrogen | A21245 | 1:500 Figure 1—figure supplement 1A |
| Antibody | Anti-mouse IgM-AlexaFluor 488 (goat polyclonal) | Invitrogen | A21042 | 1:500 Figure 3—figure supplement 3C |
| Cell line (Mus musculus) | Hybridoma anti-HA (clone 12CA5) | Field et al., 1988 | Mouse monoclonal, IgG2b, kappa | |
| Cell line (Mus musculus) | Hybridoma anti-Myc (clone 9E10) | Evan et al., 1985 | Mouse monoclonal, IgG1, kappa | |
| Gene (Mus musculus) | 12CA5-ig-gamma-2b | This study | LC522514 | Gene |
| Gene (Mus musculus) | 12CA5-ig-kappa | This study | LC522515 | Gene |
| Recombinant DNA reagent | morphotrap | Harmansa et al., 2015 | ||
| Recombinant DNA reagent | pET21b-Phep_3797 (plasmid) | Hashimoto et al., 2014 | ||
| Recombinant DNA reagent | pCSf107-SP-HepIII-HA-GPI (plasmid) | This study | ||
| Software, algorithm | PyCorrFit | Müller et al., 2014 | Version 1.1.7 | Windows version |
| Software, algorithm | Fiji | Schindelin et al., 2012 | ||
| Software, algorithm | image J | NIH | ||
| Software, algorithm | Zen2009 | Zeiss | ||
| Software, algorithm | Matlab Curve Fitting Toolbox |
Mathworks | ||
| Software, algorithm | R | The R Foundation |
All experiments using Xenopus laevis were approved by the Institutional Animal Care and Use Committee, National Institutes of Natural Sciences (Permit Number 18A038, 19A062, 20A053), or the Office for Life Science Research Ethics and Safety, University of Tokyo.
Xenopus embryo manipulation and microinjection
Unfertilized eggs of Xenopus laevis were obtained by injection of gonadotropin (ASKA Pharmaceutical). These eggs were artificially fertilized with testis homogenates and dejellied using 4% L-cysteine (adjusted to pH 7.8 with NaOH). Embryos were incubated in 1/10x Steinberg’s solution at 14–17°C and were staged according to Nieuwkoop and Faber, 1967. Synthesized mRNAs were microinjected into early (2–16 cell) embryos. Amounts of injected mRNAs are described in figure legends.
Fluorescent image acquisition
Image acquisition was performed using confocal microscopes (TSC SP8 system with HC PL APO ×10/NA0.40 dry objective or HC PL APO2 ×40/NA1.10 W CORR water immersion objective, Leica or LSM710 system with C-Apochromat 40x/1.2 W Corr M27 water immersion objective, Zeiss). Photon counting images were acquired with a HyD detector (Leica). Detailed conditions for imaging are available upon request. mV was constructed by introducing an A206K mutation to prevent protein aggregation (Zacharias et al., 2002). For FDAP and FCS measurements, gastrula embryos were embedded on 35 mm glass-based dishes (Iwaki) with 1.5% LMP agarose (#16520–050; Invitrogen) gel, which was made of 1/10x Steinberg’s solution. For other types of live-imaging, embryos were mounted in a silicone chamber made in-house with holes 1.8 mm in diameter. Fluorescent intensity was measured using Fiji, Image J (NIH) or Zen2009 (Zeiss).
Cell lines
Hybridomas (derived from mouse, 12CA5, anti-HA; 9E10, anti-Myc) were used to obtain their total RNA and subsequent cloning of immunoglobulin genes. These hybridomas have been neither authenticated nor tested for mycoplasma because no assays were performed with these hybridomas themselves. Instead, we confirmed generation of functional anti-HA or anti-Myc IgG from the cloned genes by co-IP assay.
Immunostaining of Xenopus embryos
Immunostaining of Xenopus embryos was carried out according to a previous report (Mii et al., 2017). Briefly, embryos were fixed with MEMFA (0.1 M MOPS pH 7.4, 4 mM EGTA, 2 mM MgSO4, 3.7% formaldehyde) 2 hr at room temperature. Fixed embryos were dehydrated with EtOH (EtOH treatment improves staining with anti-Wnt8 and anti-HS antibodies). After rehydration, embryos were washed with TBT (1x TBS, 0.2% BSA, 0.1% Triton X-100) and blocked with TBTS (TBT supplemented with 10% heat-treated [70°C, 40 min] fetal bovine serum). The following procedures are similar for primary and secondary antibodies. Antibody was diluted with TBTS and was centrifuged 15 min at 15,000 rpm before use. Embryos were incubated with the supernatant of antibody solution overnight at 4°C. Then embryos were washed five times with TBT.
cDNA cloning of IgG from cultured hybridomas
Cultured hybridomas were harvested by centrifugation and total RNAs were prepared using ISOGEN (Nippon Gene), according to the manufacturer’s protocol. First strand cDNA pools were synthesized using SuperScript II reverse transcriptase (Invitrogen) and random hexamer oligo DNA. These cDNA pools were used as templates for PCR to isolate cDNAs for heavy chains and light chains of anti-HA and anti-Myc IgGs. See Supplementary file 1 for all primers used for PCR cloning. Full-length cDNAs were cloned into the pCSf107mT vector (Mii and Taira, 2009).
Cultured hybridoma cells were harvested by centrifugation and total RNAs were prepared using ISOGEN (Nippon Gene), according to the manufacturer’s protocol. First strand cDNA pools were synthesized using SuperScript II reverse transcriptase (Invitrogen) and random hexamer oligo DNA. These cDNA pools were used as templates for PCR to isolate cDNAs for heavy and light chains of anti-HA and anti-Myc IgGs.
Procedures for PCR cloning were as follows. IgG cDNAs for 3' regions of CDSs were obtained by PCR with degenerate primers (5' γ-F and 5' κ-F) and primers corresponding to constant regions of Ig genes (γ2b-const-R, γ1-const-R, 3' κ-R) (Wang et al., 2000). To obtain the complete CDSs, 5'RACE was carried out to obtain the first codons of Ig genes, using a modified protocol in which inosines are introduced into the G-stretch of the HSPst-G10 anchor (personal communications from Dr. Min K. Park). cDNAs were synthesized with gene-specific primers (HA-heavy-R1, Myc-heavy-R1, HA-light-R1, and Myc-light-R1), and tailed with poly-(C) by terminal deoxynucleotidyl transferase, and subsequently double-stranded cDNAs were synthesized with the HSPst-G10 anchor. 5' ends of cDNAs were amplified by PCR between the HSPst adaptor and gene-specific primers (HA-heavy-R2, Myc-heavy-R2, HA-light-R2 and Myc-light-R2) using the double-stranded cDNAs as templates. Full length CDSs were amplified using primers designed for both ends of the CDSs (HH-Bam-F, MH-Bam-F, HL-bam-F, and ML-Bgl-F for 5’ ends; 3' γ2b-R, 3' γ1-R and 3' κ-R for the 3’ end) and the first cDNA pools. See Supplementary file 1 for all primers used for PCR cloning. Full-length cDNAs were cloned into the pCSf107mT vector (Mii and Taira, 2009). Sequence data for anti-HA IgG genes have been deposited in Genbank/DDBJ under accession codes LC522514 and LC522515.
FDAP measurements
For expression in the animal cap region of Xenopus embryos, four-cell-stage Xenopus laevis embryos were microinjected with mRNAs for mK-Wnt8 and mK-Frzb (4.0 ng/embryo) at a ventral blastomere. Injected embryos were incubated at 14°C until the gastrula stage (st. 10.25–11.5) for subsequent confocal analysis. FDAP measurements were performed using the LSM710 system (Zeiss) with a C-Apochromat ×40, NA1.2 water immersion objective. Time-lapse image acquisition was carried out for 20 s each at 25 frames/s, and after 4 s (100 frames) from the start, intercellular mK-fusion proteins were photoconverted at a small rectangular region (1.66 × 2.49 μm) with 405 nm laser irradiation. After photoconversion, images were acquired for 16 s (400 frames). Red fluorescent intensities within the rectangular region where photoconversion was performed, were analysed by curve-fitting to Equation 1 (Figure 4D) or Equation 2 (Figure 4—figure supplement 3A), using the Curve Fitting Toolbox of MATLAB (Mathworks).
FCS measurements
FCS measurements were carried out using a ConfoCor2 system (objective: C-Apochromat ×40, NA1.2 water immersion) (Zeiss; Figure 3—figure supplement 2 only) according to a previous report (Pack et al., 2006) or a TSC SP8 equipped with FCS (objective: HC PL APO 63x/1.20 W motCORR CS2) (Leica). mRNAs for mV-Wnt8 and sec-mV were microinjected into four- or eight-cell stage Xenopus embryos. Injected embryos were measured at gastrula stage (st. 10.5–11.5). Rhodamine 6G (Sigma-Aldrich) was used to calibrate detection volume, with a reported value of its diffusion coefficient (280 μm2/s) (Pack et al., 2006). PyCorrFit software (Müller et al., 2014) was used for curve-fitting analyses of FCS data from the Leica system. Models considering three-dimensional free diffusion with a Gaussian laser profile, including a triplet component (‘T + 3D’, a one-component model or ‘T + 3D + 3D’, a two-component model) were used for fitting. Akaike information criterion (AIC) was used to compare fitting with the one-component and two-component models according to a previous report (Tsutsumi et al., 2016).
Plasmid construction
pCSf107mT (Mii and Taira, 2009) was used to make most plasmid constructs for mRNA synthesis. pCSf107SPw-mT and pCSf107SPf-mT were constructed, which have the original signal peptides of Wnt8 and Frzb, respectively. The coding sequence (CDS) for mVenus (mV) or mKikGR (mK) was inserted into the BamHI site of pCSf107SPw-mT or pCSf107SPf-mT to construct pCSf107SPw-mV-mT, pCSf107SPf-mV-mT, pCSf107SPw-mK-mT, and pCSf107SPf-mK-mT. Constructs for SP-mV, SP-mV-HB, and SP-mV-2HA were made with pCSf107SPf-mT. pCS2 +HA-IgH-TM-2FT (the heavy chain for anti-HA IgG with the transmembrane domain of a membrane-bound form of IgG heavy chain) was made by inserting the full length CDS of heavy chain of anti-HA IgG without the stop codon (using the EcoRI and BglII sites) and a partial CDS fragment corresponding to the IgG transmembrane domain (using the BglII and XbaI sites) into the EcoRI/XbaI sites of pCS2 +mcs-2FT-T. To construct pCSf107-SP-HepIII-HA-GPI, HepIII CDS was inserted into pCSf107-SP-mcs-4xHA-GPI.
Luciferase reporter assays
Luciferase reporter assays were carried out as previously described (Mii and Taira, 2009). Multiple comparisons were carried out with pairwise Wilcoxon rank sum test (two-sided) in which significance levels (p-values) were adjusted by the Holm method, using R.
Mathematical modeling
Two ligand components were considered: free and bound. This model includes five dynamic processes: (i) production of ligands, (ii) diffusion of the free component in intercellular space, (iii) binding of ligands to dotted structures (‘docking sites’) such as HS clusters on the surface of cells, (iv) release of the bound component from ‘docking sites,’ and (v) internalization of the bound component into cells. The model in one-dimensional space is written as:
| (3) |
| (4) |
where u and v represent the amounts of free and bound components of morphogen molecules, respectively. The symbols a(x), b, c, and g(x) represent binding, release, internalization, and production rates, respectively. D represents the diffusion coefficient of the free component in the extracellular space. The ligand is assumed to be produced in a limited region using the following function:
| (6) |
We assumed that the binding rate a(x) depends on the position x, following heterogeneous distribution of HS clusters on the cell surface. The following function was used for a(x):
| (7) |
where p1 and p2 are the interval and width, respectively, of docking sites. We used the no-flux (Neumann) boundary condition at x = 0 and L. We calculated the model by numerical simulation. The initial distributions of u and v were set at 0 throughout the entire space. In the one-dimensional space, distributions of free (u) and bound (v) components of secreted proteins were obtained by computer simulation, where the spatial length L = 1000 (μm). Distributions of u (red) and v (blue) are presented at time t = 100 (sec), which almost reached steady states. We used the forward difference method with the spatial step Δx = 0.1 and temporal step Δt = 0.0001 in numerical calculations. In Figure 5B, parameter values are: D = 20.0, an,max = 10.0, b = 0.1, c = 0.1, gmax = 0.2, R = L/1000, p1 = 2, and p2 = 0.2. In other panels, distributions in specific conditions are shown (see figure legends).
Acknowledgements
We thank Dr. Min Kyun Park for hybridoma culture and 5’RACE for IgG cDNAs. We also thank Dr. A Miyawaki for Venus cDNA; Dr. R Moon for pCS2+Xwnt8; Dr. M Affolter for morphotrap cDNA; Dr. W Hashimoto for the HepIII plasmid (pET21b-Phep_3797); Dr. Shinya Matsuda for critical reading; Drs. Hiroshi Koyama, Yohei Kondo and Motosuke Tsutsumi for discussion and Dr. Steven D Aird for editing and proofreading. We thank the Confocal Microscope core facility at the ConveRgence mEDIcine research cenTer (CREDIT), Asan Medical Center. This work was supported in part by following programs: KAKENHI (24870031, 15K14532, 18K14720 to YM; 19H05670 to AM; 24657147, 18H02447, 25251026 to MT; 17K19418, 18H02454, 19H04797 to ST), the NINS program for cross-disciplinary study (1311608, 01311801 to YM), Joint Usage/Research Center program of Institute for Frontier Life and Medical Sciences Kyoto University, JST-PRESTO (JPMJPR194B to YM), JST-CREST (JPMJCR13W6, JPMJCR1922 to AM).
Appendix 1
Detecting freely diffusing molecules with confocal microscopy
When we consider detection of diffusing molecules with confocal microscopy, diffusing molecules might not be detected because of their large displacement. In our imaging conditions, pixel dwell time was 24.4 μs and observed maximum Dfast in FCS was about 80 μm2/s (Figure S3E). During pixel dwell time t, mean square displacement (MSD) of molecules of diffusion coefficient D in three-dimensional space is 6Dt (Crank, 1975). Therefore, maximum MSD is estimated as
Accordingly, mean displacement of the molecules at the maximum is
On the other hand, when the numerical aperture (NA) of an objective lens is given, the Reyligh diffraction limit in our conditions is calculated as
This value of the diffraction limit is larger than the so that even the most rapidly diffusing molecules observed in FCS measurements, loss of fluorescence due to diffusion is not likely to occur. Indeed, we detected slight but significant increase of photon counts with sec-mV (Figure 1D and Figure 1—figure supplement 2) with a long pixel dwell time. We speculate that the difficulty of visualizing sec-mV is mainly due to narrowness of extracellular space in Xenopus embryos
Funding Statement
The funders had no role in study design, data collection and interpretation, or the decision to submit the work for publication.
Contributor Information
Yusuke Mii, Email: mii@nibb.ac.jp.
Masanori Taira, Email: m-taira.183@g.chuo-u.ac.jp.
Shinji Takada, Email: stakada@nibb.ac.jp.
Ariel M Pani, University of Virginia, United States.
Naama Barkai, Weizmann Institute of Science, Israel.
Funding Information
This paper was supported by the following grants:
Japan Science and Technology Agency JPMJPR194B to Yusuke Mii.
Japan Society for the Promotion of Science 24870031 to Yusuke Mii.
Japan Society for the Promotion of Science 15K14532 to Yusuke Mii.
Japan Society for the Promotion of Science 18K14720 to Yusuke Mii.
National Institutes of Natural Sciences 1311608 to Yusuke Mii.
National Institutes of Natural Sciences 01311801 to Yusuke Mii.
Japan Society for the Promotion of Science 24657147 to Yusuke Mii, Masanori Taira.
Japan Society for the Promotion of Science 18H02447 to Masanori Taira.
Japan Society for the Promotion of Science 25251026 to Masanori Taira.
Japan Science and Technology Agency JPMJCR13W6 to Atsushi Mochizuki.
Japan Science and Technology Agency JPMJCR1922 to Atsushi Mochizuki.
Japan Society for the Promotion of Science 19H05670 to Atsushi Mochizuki.
Japan Society for the Promotion of Science 17K19418 to Shinji Takada.
Japan Society for the Promotion of Science 18H02454 to Shinji Takada.
Japan Society for the Promotion of Science 19H04797 to Shinji Takada.
Additional information
Competing interests
No competing interests declared.
Author contributions
Conceptualization, Data curation, Formal analysis, Funding acquisition, Validation, Investigation, Visualization, Methodology, Writing - original draft, Writing - review and editing.
Software, Formal analysis, Investigation.
Data curation, Formal analysis, Methodology.
Resources, Investigation.
Investigation, Methodology.
Software, Supervision, Writing - original draft.
Conceptualization, Investigation, Supervision, Funding acquisition, Writing - original draft, Writing - review and editing.
Conceptualization, Investigation, Supervision, Funding acquisition, Writing - original draft, Writing - review and editing.
Ethics
Animal experimentation: All experiments using Xenopus laevis were approved by the Institutional Animal Care and Use Committee, National Institutes of Natural Sciences (Permit Number 18A038, 19A062, 20A053), or the Office for Life Science Research Ethics and Safety, University of Tokyo.
Additional files
All source code files are written in C. An executable file ‘a.out’ will be generated by compilation. By executing ‘a.out’, amounts of u (free) and v (bound) at each position in the field is recorded in a data file ‘dists_uv.dat’.
See the section of ‘cDNA cloning of IgG from cultured hybridomas’ in Materials and methods for details.
Data availability
Sequence data for anti-HA IgG genes have been deposited in Genbank/DDBJ under accession codes LC522514 and LC522515.
The following datasets were generated:
Mii Y. 2020. Mus musculus mRNA for immunoglobulin gamma 2b, complete cds. NCBI GenBank. LC522514.1
Mii Y. 2020. Mus musculus mRNA for immunoglobulin kappa, complete cds. NCBI GenBank. LC522515.1
References
- Alexandre C, Baena-Lopez A, Vincent JP. Patterning and growth control by membrane-tethered wingless. Nature. 2014;505:180–185. doi: 10.1038/nature12879. [DOI] [PMC free article] [PubMed] [Google Scholar]
- Baeg GH, Selva EM, Goodman RM, Dasgupta R, Perrimon N. The wingless morphogen gradient is established by the cooperative action of frizzled and heparan sulfate proteoglycan receptors. Developmental Biology. 2004;276:89–100. doi: 10.1016/j.ydbio.2004.08.023. [DOI] [PubMed] [Google Scholar]
- Chaudhary V, Hingole S, Frei J, Port F, Strutt D, Boutros M. Robust wnt signaling is maintained by a wg protein gradient and Fz2 receptor activity in the developing Drosophila wing. Development. 2019;146:dev174789. doi: 10.1242/dev.174789. [DOI] [PMC free article] [PubMed] [Google Scholar]
- Clevers H, Loh KM, Nusse R. Stem cell signaling an integral program for tissue renewal and regeneration: wnt signaling and stem cell control. Science. 2014;346:1248012. doi: 10.1126/science.1248012. [DOI] [PubMed] [Google Scholar]
- Clevers H, Nusse R. Wnt/β-catenin signaling and disease. Cell. 2012;149:1192–1205. doi: 10.1016/j.cell.2012.05.012. [DOI] [PubMed] [Google Scholar]
- Crank J. The Mathematics of Diffusion. Oxford University Press; 1975. [Google Scholar]
- Evan GI, Lewis GK, Ramsay G, Bishop JM. Isolation of monoclonal antibodies specific for human c-myc proto-oncogene product. Molecular and Cellular Biology. 1985;5:3610–3616. doi: 10.1128/MCB.5.12.3610. [DOI] [PMC free article] [PubMed] [Google Scholar]
- Farin HF, Jordens I, Mosa MH, Basak O, Korving J, Tauriello DV, de Punder K, Angers S, Peters PJ, Maurice MM, Clevers H. Visualization of a short-range wnt gradient in the intestinal stem-cell niche. Nature. 2016;530:340–343. doi: 10.1038/nature16937. [DOI] [PubMed] [Google Scholar]
- Field J, Nikawa J, Broek D, MacDonald B, Rodgers L, Wilson IA, Lerner RA, Wigler M. Purification of a RAS-responsive adenylyl cyclase complex from Saccharomyces cerevisiae by use of an epitope addition method. Molecular and Cellular Biology. 1988;8:2159–2165. doi: 10.1128/MCB.8.5.2159. [DOI] [PMC free article] [PubMed] [Google Scholar]
- Fradin C. On the importance of protein diffusion in biological systems: the example of the bicoid morphogen gradient. Biochimica Et Biophysica Acta (BBA) - Proteins and Proteomics. 2017;1865:1676–1686. doi: 10.1016/j.bbapap.2017.09.002. [DOI] [PubMed] [Google Scholar]
- Franch-Marro X, Marchand O, Piddini E, Ricardo S, Alexandre C, Vincent JP. Glypicans shunt the wingless signal between local signalling and further transport. Development. 2005;132:659–666. doi: 10.1242/dev.01639. [DOI] [PubMed] [Google Scholar]
- Habuchi S, Tsutsui H, Kochaniak AB, Miyawaki A, van Oijen AM. mKikGR, a monomeric photoswitchable fluorescent protein. PLOS ONE. 2008;3:e3944. doi: 10.1371/journal.pone.0003944. [DOI] [PMC free article] [PubMed] [Google Scholar]
- Han C, Yan D, Belenkaya TY, Lin X. Drosophila glypicans dally and Dally-like shape the extracellular wingless morphogen gradient in the wing disc. Development. 2005;132:667–679. doi: 10.1242/dev.01636. [DOI] [PubMed] [Google Scholar]
- Harmansa S, Hamaratoglu F, Affolter M, Caussinus E. Dpp spreading is required for medial but not for lateral wing disc growth. Nature. 2015;527:317–322. doi: 10.1038/nature15712. [DOI] [PubMed] [Google Scholar]
- Hashimoto W, Maruyama Y, Nakamichi Y, Mikami B, Murata K. Crystal structure of Pedobacter heparinus heparin lyase hep III with the active site in a deep cleft. Biochemistry. 2014;53:777–786. doi: 10.1021/bi4012463. [DOI] [PubMed] [Google Scholar]
- Hess ST, Huang S, Heikal AA, Webb WW. Biological and chemical applications of fluorescence correlation spectroscopy: a review. Biochemistry. 2002;41:697–705. doi: 10.1021/bi0118512. [DOI] [PubMed] [Google Scholar]
- Kerszberg M, Wolpert L. Mechanisms for positional signalling by morphogen transport: a theoretical study. Journal of Theoretical Biology. 1998;191:103–114. doi: 10.1006/jtbi.1997.0575. [DOI] [PubMed] [Google Scholar]
- Kicheva A, Pantazis P, Bollenbach T, Kalaidzidis Y, Bittig T, Jülicher F, González-Gaitán M. Kinetics of morphogen gradient formation. Science. 2007;315:521–525. doi: 10.1126/science.1135774. [DOI] [PubMed] [Google Scholar]
- Kicheva A, Bollenbach T, Wartlick O, Jülicher F, Gonzalez-Gaitan M. Investigating the principles of morphogen gradient formation: from tissues to cells. Current Opinion in Genetics & Development. 2012;22:527–532. doi: 10.1016/j.gde.2012.08.004. [DOI] [PubMed] [Google Scholar]
- Kiecker C, Niehrs C. A morphogen gradient of wnt/beta-catenin signalling regulates anteroposterior neural patterning in Xenopus. Development. 2001;128:4189–4201. doi: 10.1242/dev.128.21.4189. [DOI] [PubMed] [Google Scholar]
- Kikuchi A, Yamamoto H, Sato A. Selective activation mechanisms of wnt signaling pathways. Trends in Cell Biology. 2009;19:119–129. doi: 10.1016/j.tcb.2009.01.003. [DOI] [PubMed] [Google Scholar]
- Kure S, Yoshie O. A syngeneic monoclonal antibody to murine Meth-A sarcoma (HepSS-1) recognizes heparan sulfate glycosaminoglycan (HS-GAG): cell density and transformation dependent alteration in cell surface HS-GAG defined by HepSS-1. Journal of Immunology. 1986;137:3900–3908. [PubMed] [Google Scholar]
- Lin X. Functions of heparan sulfate proteoglycans in cell signaling during development. Development. 2004;131:6009–6021. doi: 10.1242/dev.01522. [DOI] [PubMed] [Google Scholar]
- Loh KM, van Amerongen R, Nusse R. Generating cellular diversity and spatial form: wnt signaling and the evolution of multicellular animals. Developmental Cell. 2016;38:643–655. doi: 10.1016/j.devcel.2016.08.011. [DOI] [PubMed] [Google Scholar]
- MacDonald BT, Tamai K, He X. Wnt/beta-catenin signaling: components, mechanisms, and diseases. Developmental Cell. 2009;17:9–26. doi: 10.1016/j.devcel.2009.06.016. [DOI] [PMC free article] [PubMed] [Google Scholar]
- Marjoram L, Wright C. Rapid differential transport of nodal and lefty on sulfated proteoglycan-rich extracellular matrix regulates left-right asymmetry in Xenopus. Development. 2011;138:475–485. doi: 10.1242/dev.056010. [DOI] [PMC free article] [PubMed] [Google Scholar]
- Matsuda T, Miyawaki A, Nagai T. Direct measurement of protein dynamics inside cells using a rationally designed photoconvertible protein. Nature Methods. 2008;5:339–345. doi: 10.1038/nmeth.1193. [DOI] [PubMed] [Google Scholar]
- Mii Y, Yamamoto T, Takada R, Mizumoto S, Matsuyama M, Yamada S, Takada S, Taira M. Roles of two types of heparan sulfate clusters in wnt distribution and signaling in Xenopus. Nature Communications. 2017;8:1973. doi: 10.1038/s41467-017-02076-0. [DOI] [PMC free article] [PubMed] [Google Scholar]
- Mii Y, Taira M. Secreted Frizzled-related proteins enhance the diffusion of wnt ligands and expand their signalling range. Development. 2009;136:4083–4088. doi: 10.1242/dev.032524. [DOI] [PubMed] [Google Scholar]
- Mii Y, Takada S. Heparan sulfate proteoglycan clustering in wnt signaling and dispersal. Frontiers in Cell and Developmental Biology. 2020;8:631. doi: 10.3389/fcell.2020.00631. [DOI] [PMC free article] [PubMed] [Google Scholar]
- Müller P, Rogers KW, Jordan BM, Lee JS, Robson D, Ramanathan S, Schier AF. Differential diffusivity of nodal and lefty underlies a reaction-diffusion patterning system. Science. 2012;336:721–724. doi: 10.1126/science.1221920. [DOI] [PMC free article] [PubMed] [Google Scholar]
- Müller P, Rogers KW, Yu SR, Brand M, Schier AF. Morphogen transport. Development. 2013;140:1621–1638. doi: 10.1242/dev.083519. [DOI] [PMC free article] [PubMed] [Google Scholar]
- Müller P, Schwille P, Weidemann T. PyCorrFit-generic data evaluation for fluorescence correlation spectroscopy. Bioinformatics. 2014;30:2532–2533. doi: 10.1093/bioinformatics/btu328. [DOI] [PMC free article] [PubMed] [Google Scholar]
- Nieuwkoop PD, Faber J. Normal Table of Xenopus laevis (Daudin) Garland Science; 1967. [Google Scholar]
- Nusse R, Clevers H. Wnt/β-Catenin signaling, disease, and emerging therapeutic modalities. Cell. 2017;169:985–999. doi: 10.1016/j.cell.2017.05.016. [DOI] [PubMed] [Google Scholar]
- Pack C, Saito K, Tamura M, Kinjo M. Microenvironment and effect of energy depletion in the nucleus analyzed by mobility of multiple oligomeric EGFPs. Biophysical Journal. 2006;91:3921–3936. doi: 10.1529/biophysj.105.079467. [DOI] [PMC free article] [PubMed] [Google Scholar]
- Pani AM, Goldstein B. Direct visualization of a native wnt in vivo reveals that a long-range wnt gradient forms by extracellular dispersal. eLife. 2018;7:e38325. doi: 10.7554/eLife.38325. [DOI] [PMC free article] [PubMed] [Google Scholar]
- Plouhinec J-L, Zakin L, Moriyama Y, De Robertis EM. Chordin forms a self-organizing morphogen gradient in the extracellular space between ectoderm and mesoderm in the Xenopus embryo. PNAS. 2013;110:20372–20379. doi: 10.1073/pnas.1319745110. [DOI] [PMC free article] [PubMed] [Google Scholar]
- Rogers KW, Schier AF. Morphogen gradients: from generation to interpretation. Annual Review of Cell and Developmental Biology. 2011;27:377–407. doi: 10.1146/annurev-cellbio-092910-154148. [DOI] [PubMed] [Google Scholar]
- Routledge D, Scholpp S. Mechanisms of intercellular wnt transport. Development. 2019;146:dev176073. doi: 10.1242/dev.176073. [DOI] [PubMed] [Google Scholar]
- Roy S, Hsiung F, Kornberg TB. Specificity of Drosophila cytonemes for distinct signaling pathways. Science. 2011;332:354–358. doi: 10.1126/science.1198949. [DOI] [PMC free article] [PubMed] [Google Scholar]
- Schindelin J, Arganda-Carreras I, Frise E, Kaynig V, Longair M, Pietzsch T, Preibisch S, Rueden C, Saalfeld S, Schmid B, Tinevez JY, White DJ, Hartenstein V, Eliceiri K, Tomancak P, Cardona A. Fiji: an open-source platform for biological-image analysis. Nature Methods. 2012;9:676–682. doi: 10.1038/nmeth.2019. [DOI] [PMC free article] [PubMed] [Google Scholar]
- Session AM, Uno Y, Kwon T, Chapman JA, Toyoda A, Takahashi S, Fukui A, Hikosaka A, Suzuki A, Kondo M, van Heeringen SJ, Quigley I, Heinz S, Ogino H, Ochi H, Hellsten U, Lyons JB, Simakov O, Putnam N, Stites J, Kuroki Y, Tanaka T, Michiue T, Watanabe M, Bogdanovic O, Lister R, Georgiou G, Paranjpe SS, van Kruijsbergen I, Shu S, Carlson J, Kinoshita T, Ohta Y, Mawaribuchi S, Jenkins J, Grimwood J, Schmutz J, Mitros T, Mozaffari SV, Suzuki Y, Haramoto Y, Yamamoto TS, Takagi C, Heald R, Miller K, Haudenschild C, Kitzman J, Nakayama T, Izutsu Y, Robert J, Fortriede J, Burns K, Lotay V, Karimi K, Yasuoka Y, Dichmann DS, Flajnik MF, Houston DW, Shendure J, DuPasquier L, Vize PD, Zorn AM, Ito M, Marcotte EM, Wallingford JB, Ito Y, Asashima M, Ueno N, Matsuda Y, Veenstra GJC, Fujiyama A, Harland RM, Taira M, Rokhsar DS. Genome evolution in the allotetraploid frog Xenopus laevis. Nature. 2016;538:336–343. doi: 10.1038/nature19840. [DOI] [PMC free article] [PubMed] [Google Scholar]
- Shimokawa K, Kimura-Yoshida C, Nagai N, Mukai K, Matsubara K, Watanabe H, Matsuda Y, Mochida K, Matsuo I. Cell surface heparan sulfate chains regulate local reception of FGF signaling in the mouse embryo. Developmental Cell. 2011;21:257–272. doi: 10.1016/j.devcel.2011.06.027. [DOI] [PubMed] [Google Scholar]
- Smith JC. Forming and interpreting gradients in the early Xenopus embryo. Cold Spring Harbor Perspectives in Biology. 2009;1:a002477. doi: 10.1101/cshperspect.a002477. [DOI] [PMC free article] [PubMed] [Google Scholar]
- Sprague BL, Pego RL, Stavreva DA, McNally JG. Analysis of binding reactions by fluorescence recovery after photobleaching. Biophysical Journal. 2004;86:3473–3495. doi: 10.1529/biophysj.103.026765. [DOI] [PMC free article] [PubMed] [Google Scholar]
- Sprague BL, McNally JG. FRAP analysis of binding: proper and fitting. Trends in Cell Biology. 2005;15:84–91. doi: 10.1016/j.tcb.2004.12.001. [DOI] [PubMed] [Google Scholar]
- Stanganello E, Hagemann AI, Mattes B, Sinner C, Meyen D, Weber S, Schug A, Raz E, Scholpp S. Filopodia-based wnt transport during vertebrate tissue patterning. Nature Communications. 2015;6:5846. doi: 10.1038/ncomms6846. [DOI] [PubMed] [Google Scholar]
- Stapornwongkul KS, de Gennes M, Cocconi L, Salbreux G, Vincent JP. Patterning and growth control in vivo by an engineered GFP gradient. Science. 2020;370:321–327. doi: 10.1126/science.abb8205. [DOI] [PMC free article] [PubMed] [Google Scholar]
- Strigini M, Cohen SM. Wingless gradient formation in the Drosophila wing. Current Biology. 2000;10:293–300. doi: 10.1016/S0960-9822(00)00378-X. [DOI] [PubMed] [Google Scholar]
- Suzuki K, Yamamoto K, Kariya Y, Maeda H, Ishimaru T, Miyaura S, Fujii M, Yusa A, Joo EJ, Kimata K, Kannagi R, Kim YS, Kyogashima M. Generation and characterization of a series of monoclonal antibodies that specifically recognize [HexA(+/-2S)-GlcNAc]n epitopes in heparan sulfate. Glycoconjugate Journal. 2008;25:703–712. doi: 10.1007/s10719-008-9130-z. [DOI] [PubMed] [Google Scholar]
- Tabata T, Takei Y. Morphogens, their identification and regulation. Development. 2004;131:703–712. doi: 10.1242/dev.01043. [DOI] [PubMed] [Google Scholar]
- Takada R, Mii Y, Krayukhina E, Maruyama Y, Mio K, Sasaki Y, Shinkawa T, Pack CG, Sako Y, Sato C, Uchiyama S, Takada S. Assembly of protein complexes restricts diffusion of Wnt3a proteins. Communications Biology. 2018;1:165. doi: 10.1038/s42003-018-0172-x. [DOI] [PMC free article] [PubMed] [Google Scholar]
- Takei Y, Ozawa Y, Sato M, Watanabe A, Tabata T. Three Drosophila EXT genes shape morphogen gradients through synthesis of heparan sulfate proteoglycans. Development. 2004;131:73–82. doi: 10.1242/dev.00913. [DOI] [PubMed] [Google Scholar]
- Toda S, McKeithan WL, Hakkinen TJ, Lopez P, Klein OD, Lim WA. Engineering synthetic morphogen systems that can program multicellular patterning. Science. 2020;370:327–331. doi: 10.1126/science.abc0033. [DOI] [PMC free article] [PubMed] [Google Scholar]
- Tsutsumi M, Muto H, Myoba S, Kimoto M, Kitamura A, Kamiya M, Kikukawa T, Takiya S, Demura M, Kawano K, Kinjo M, Aizawa T. In vivo fluorescence correlation spectroscopy analyses of FMBP-1, a silkworm transcription factor. FEBS Open Bio. 2016;6:106–125. doi: 10.1002/2211-5463.12026. [DOI] [PMC free article] [PubMed] [Google Scholar]
- van den Heuvel M, Nusse R, Johnston P, Lawrence PA. Distribution of the wingless gene product in Drosophila embryos: a protein involved in cell-cell communication. Cell. 1989;59:739–749. doi: 10.1016/0092-8674(89)90020-2. [DOI] [PubMed] [Google Scholar]
- Veerapathiran S, Teh C, Zhu S, Kartigayen I, Korzh V, Matsudaira PT, Wohland T. Wnt3 distribution in the zebrafish brain is determined by expression, diffusion and multiple molecular interactions. eLife. 2020;9:e59489. doi: 10.7554/eLife.59489. [DOI] [PMC free article] [PubMed] [Google Scholar]
- Verrecchio A, Germann MW, Schick BP, Kung B, Twardowski T, San Antonio JD. Design of peptides with high affinities for heparin and endothelial cell proteoglycans. Journal of Biological Chemistry. 2000;275:7701–7707. doi: 10.1074/jbc.275.11.7701. [DOI] [PubMed] [Google Scholar]
- Wang Z, Raifu M, Howard M, Smith L, Hansen D, Goldsby R, Ratner D. Universal PCR amplification of mouse immunoglobulin gene variable regions: the design of degenerate primers and an assessment of the effect of DNA polymerase 3' to 5' exonuclease activity. Journal of Immunological Methods. 2000;233:167–177. doi: 10.1016/S0022-1759(99)00184-2. [DOI] [PubMed] [Google Scholar]
- Yamamoto H, Komekado H, Kikuchi A. Caveolin is necessary for Wnt-3a-dependent internalization of LRP6 and accumulation of beta-catenin. Developmental Cell. 2006;11:213–223. doi: 10.1016/j.devcel.2006.07.003. [DOI] [PubMed] [Google Scholar]
- Yan D, Lin X. Shaping morphogen gradients by proteoglycans. Cold Spring Harbor Perspectives in Biology. 2009;1:a002493. doi: 10.1101/cshperspect.a002493. [DOI] [PMC free article] [PubMed] [Google Scholar]
- Yu SR, Burkhardt M, Nowak M, Ries J, Petrásek Z, Scholpp S, Schwille P, Brand M. Fgf8 morphogen gradient forms by a source-sink mechanism with freely diffusing molecules. Nature. 2009;461:533–536. doi: 10.1038/nature08391. [DOI] [PubMed] [Google Scholar]
- Zacharias DA, Violin JD, Newton AC, Tsien RY. Partitioning of lipid-modified monomeric GFPs into membrane microdomains of live cells. Science. 2002;296:913–916. doi: 10.1126/science.1068539. [DOI] [PubMed] [Google Scholar]
- Zecca M, Basler K, Struhl G. Direct and long-range action of a wingless morphogen gradient. Cell. 1996;87:833–844. doi: 10.1016/S0092-8674(00)81991-1. [DOI] [PubMed] [Google Scholar]
- Zhou S, Lo WC, Suhalim JL, Digman MA, Gratton E, Nie Q, Lander AD. Free extracellular diffusion creates the dpp morphogen gradient of the Drosophila wing disc. Current Biology. 2012;22:668–675. doi: 10.1016/j.cub.2012.02.065. [DOI] [PMC free article] [PubMed] [Google Scholar]
- Zhu AJ, Scott MP. Incredible journey: how do developmental signals travel through tissue? Genes & Development. 2004;18:2985–2997. doi: 10.1101/gad.1233104. [DOI] [PubMed] [Google Scholar]


