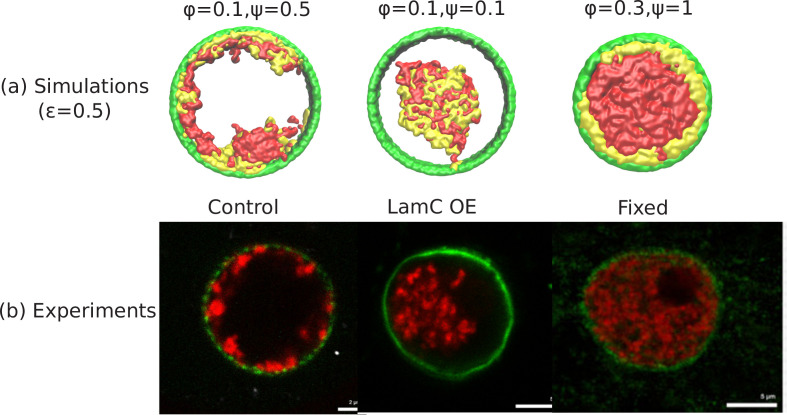
Appendix 1—figure 1. Comparison of the simulations with the experimental images.
(a) Snapshots of simulations for chromatin-chromatin attractions . For relatively small volume fraction of chromatin () and relatively high chromatin-lamina binding interactions (), the simulation shows peripheral organization of chromatin. For (small) and (small), we obtain central organization of chromatin (see Appendix 5 on the wetting droplet). For (high) and (high), the simulations show conventional organization of chromatin, where the entire nucleus is filled. (b) Different organization of chromatin obtained in the experiments: peripheral, central and conventional are seen in experiments in the control, lamin A/C overexpression and fixed nuclei respectively (Amiad-Pavlov et al., 2020).

