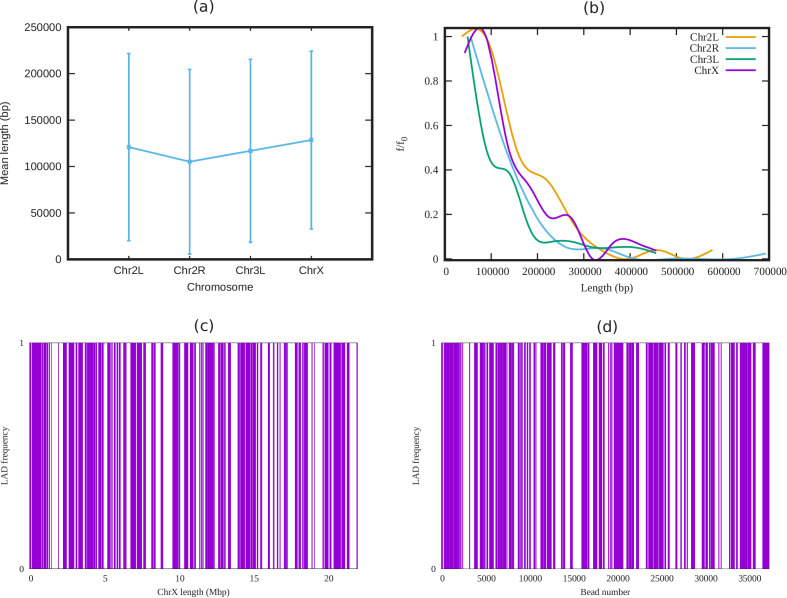
Appendix 3—figure 1. Analysis of LADs sequence data of Drosophila.
(a) Mean cluster length of LAD for different chromosomes of Drosophila (Ho et al., 2014). (b) Length distribution of LAD for different Drosophila chromosomes. In both subfigures (a) and (b), the vertical bars represent the standard deviation (SD). (c) An alternating distribution of LAD (violet) and non-LAD (white) along the 22.4 Mbp regions of chromosome X (ChrX). (d) Same LAD distribution used in our coarse-grain model with a chromatin chain of 37,333 beads. From the sequence data it is clear, LAD regions in Drosophila consist of beads, and not single ones.

