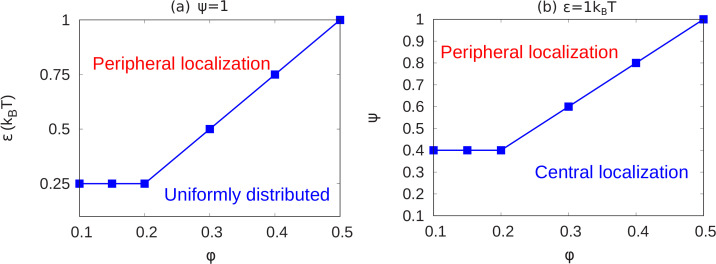
Figure 5. State diagrams showing the transition from peripheral to uniform to central localization of chromatin.
(a) For a fixed value of (maximally bonded LAD), we calculated the local volume fraction obtained from simulations with different pairs (24 pairs) of the chromatin volume fraction and self-attraction where and . For each pair of , we used the plots of the local volume fraction to determine the chromatin organization mode. In the graph, the blue line shows the transition between conventional (uniformly distributed) chromatin organization, and peripheral organization. (b) For a fixed value of the chromatin self-attraction , we calculated the local volume fraction obtained from simulations with different pairs (60 pairs) of the chromatin volume fraction and fraction of LAD that can bond to the lamina where and . The blue line shows the transition from central (and wetting drop) to peripheral chromatin organization. In figures (a) and (b), the bars are the simulation results while the line is a guide to the eye.

