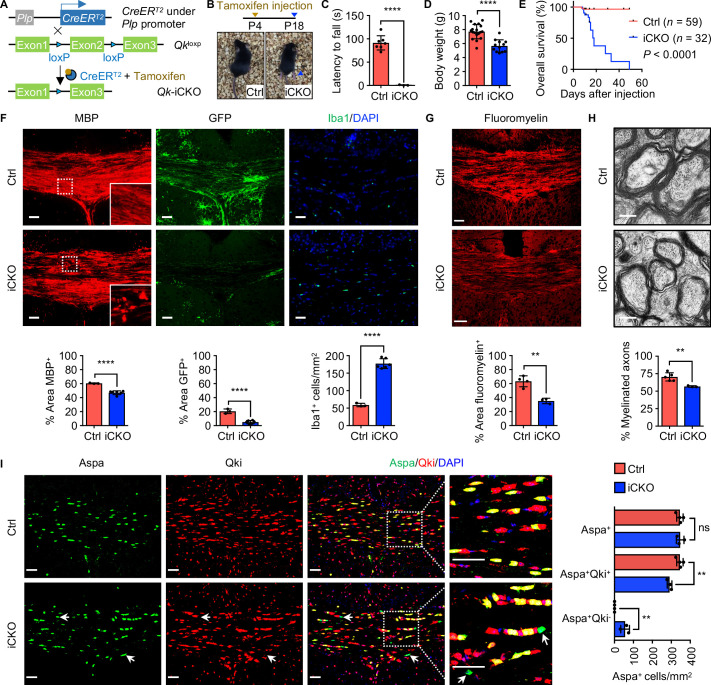
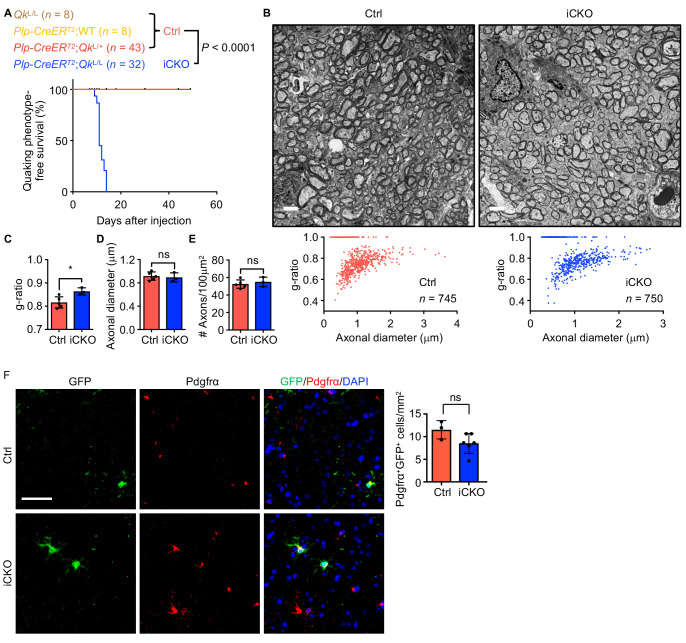
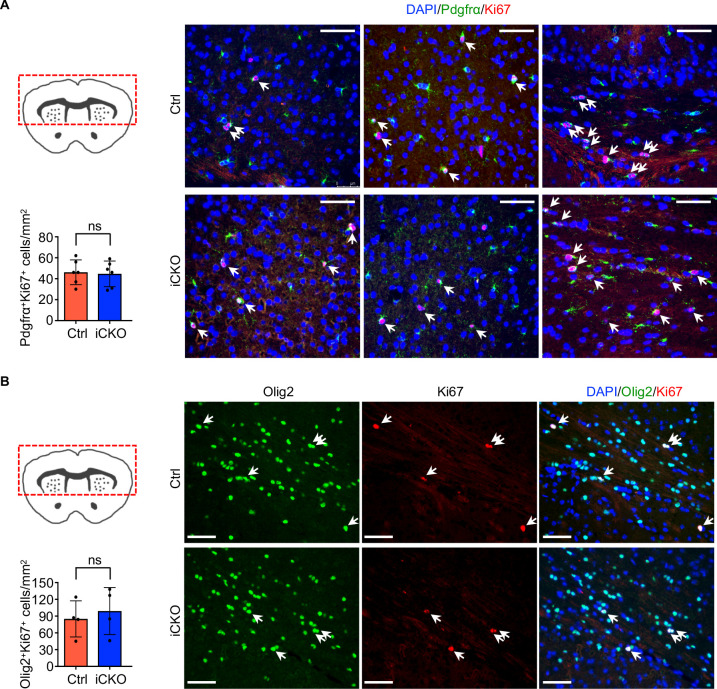
Figure 4. Qk deletion in oligodendrocyte precursor cells leads to defective myelinogenesis without impairing differentiation of Aspa+ myelinating oligodendrocytes.
(A) Schema of the generation of Qk-Plp-iCKO mice. (B) Representative images of severe hind limb paresis in Qk-Plp-iCKO mice 2 weeks after tamoxifen injection. (C) Latency of mice falling off the rotarod at a constant speed (5 rpm). n = 3 mice in the Qk-Plp-iCKO group; n = 7 mice in the control group. (D) Body weights of Qk-Plp-iCKO mice (n = 12) and control mice (n = 18) 2 weeks after tamoxifen injection. (E) Kaplan–Meier curves of and log-rank test results for overall survival in Qk-Plp-iCKO mice (n = 32) and control mice (n = 59). (F) Representative images of and quantification of immunofluorescent staining of MBP, GFP, and Iba1 in the corpus callosum tissues in Qk-Plp-iCKO mice (n = 6) and control mice (n = 3) 2 weeks after tamoxifen injection. Scale bars, 50 μm. (G) Representative images of and quantification of staining of FluoroMyelin in the corpus callosum tissues in Qk-Plp-iCKO mice (n = 3) and control mice (n = 4) 2 weeks after tamoxifen injection. Scale bars, 50 μm. (H) Representative electron micrographs of and quantification of the percentage of myelinated axons in the optic nerves in Qk-Plp-iCKO mice (n = 3) and control mice (n = 5) 2 weeks after tamoxifen injection. Scale bars, 500 nm. (I) Representative images of and quantification of immunofluorescent staining of Aspa and Qki in the corpus callosum tissues in Qk-Plp-iCKO mice (n = 3) and control mice (n = 4) 2 weeks after tamoxifen injection. Scale bars, 50 μm. Data are shown as mean ± s.d. and were analyzed using Student's t test (C,D, F–H) or one-way ANOVA with Tukey’s multiple comparisons test (I). **p<0.01; ****p<0.0001; ns: not significant.


