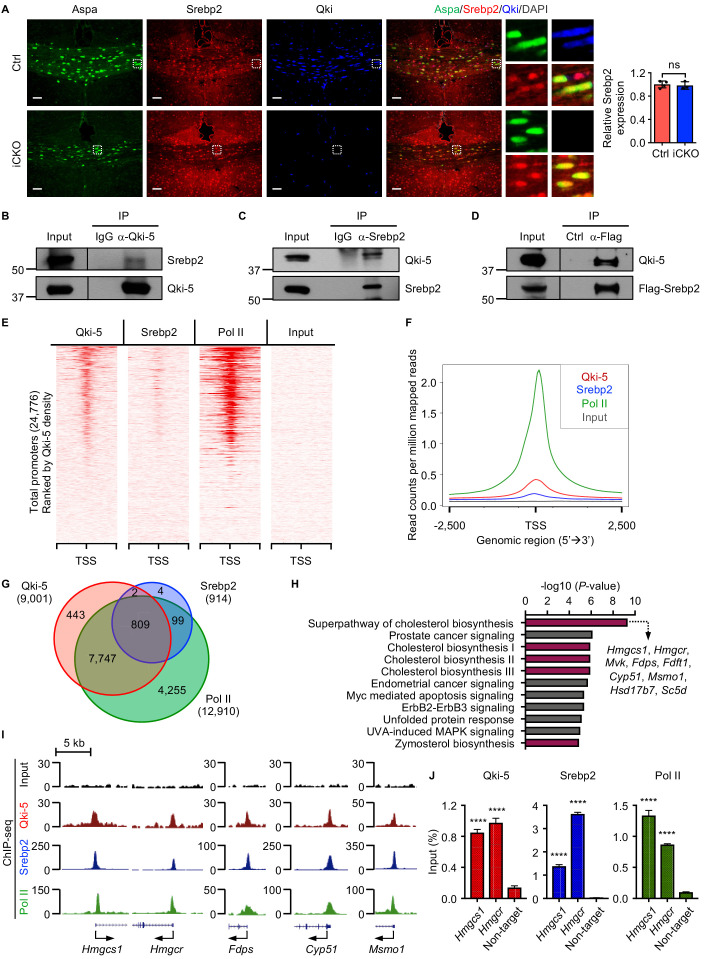
Figure 6. Qki-5 interacts with Srebp2 to regulate transcription of the genes involved in cholesterol biosynthesis.
(A) Representative images of and quantification of immunofluorescent staining of Srebp2 in Aspa+Qki- oligodendrocytes in Qk-Nestin-iCKO mice (n = 3) and Aspa+Qki+ oligodendrocytes in control mice (n = 4) 2 weeks after tamoxifen injection. Scale bars, 50 μm. (B) Results of co-immunoprecipitation (co-IP) using an anti–Qki-5 antibody with differentiated oligodendrocytes followed by detection of Srebp2 via immunoblotting. (C) Results of co-IP using an anti-Srebp2 antibody with differentiated oligodendrocytes followed by detection of Qki-5 via immunoblotting. (D) Results of co-IP using an anti-Flag antibody with differentiated oligodendrocytes having ectopic expression of Flag-Srebp2 followed by detection of Qki-5 via immunoblotting. (E, F) ChIP-seq density heat maps (E) and average genome-wide occupancies (F) of Qki-5, Srebp2, and Pol II in differentiated oligodendrocytes. Regions within 2.5 kb of the transcriptional start site (TSS) are included. All events are rank-ordered from high to low Qki-5 occupancy. (G) Venn diagram of the overlap of Qki-5-, Srebp2-, and Pol II-binding events in the promoter regions in differentiated oligodendrocytes. Promoters are defined as TSS ±2 kb. (H) Canonical pathway analysis of Qki-5-, Srebp2-, and Pol II-co-occupied genes in differentiated oligodendrocytes. Cellular pathways involved in cholesterol biosynthesis are labeled in dark pink. (I) Representative ChIP-seq binding events of Qki-5, Srebp2, and Pol II in the promoter regions of the genes involved in cholesterol biosynthesis. y-axis: normalized reads. (J) ChIP-qPCR results showing the recruitment of Qki-5, Srebp2, and Pol II to the promoter regions of Hmgcs1 and Hmgcr in differentiated oligodendrocytes. Data are shown as mean ± s.d. and were analyzed using Student’s t test. ****p<0.0001; ns: not significant.


