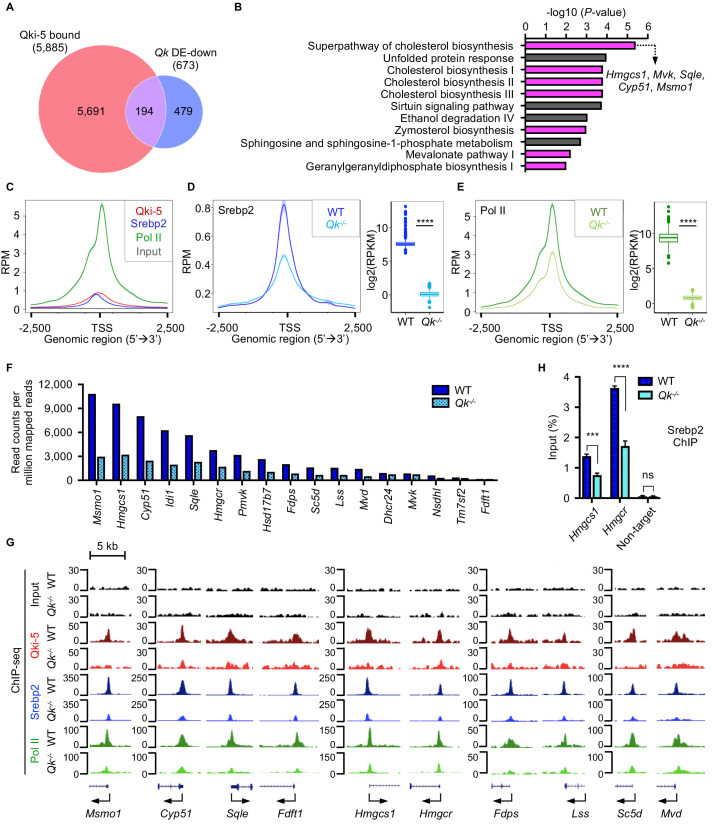
Figure 7. Qki transcriptionally enhances Srebp2-mediated cholesterol biosynthesis.
(A) Venn diagram of the overlap of Qki-5-bound genes in Qki-5 ChIP-seq from freshly isolated mouse oligodendrocytes and the genes with markedly lower expression in Qk-Plp-iCKO mice than in control mice. DE: differentially expressed. (B) Canonical pathway analysis of the 194 overlapping genes shown in (A). Cellular pathways involved in cholesterol biosynthesis are labeled in magenta. (C) Average occupancies of Qki-5, Srebp2, and Pol II in the gene clusters bound by Srebp2 (n = 914) in differentiated oligodendrocytes. Regions within 2.5 kb of the transcriptional start site (TSS) are included. (D, E) Average occupancies of Srebp2 (D) and Pol II (E) in the gene clusters bound by Srebp2 in WT and Qk-/- differentiated oligodendrocytes (left) and comparison of ChIP-seq (right). Regions within 2.5 kb of the TSS are included. RPM: reads counts per million mapped reads; RPKM: reads counts per kilobase per million mapped reads. (F) Bar graphs of the RPM of the Srebp2 ChIP-seq peaks within ± 0.5 kb from the TSS for 17 well-characterized Srebp2 target genes involved in cholesterol biosynthesis in WT and Qk-/- differentiated oligodendrocytes. (G) Representative ChIP-seq binding events of Qki-5, Srebp2, and Pol II in the promoter regions of the genes involved in cholesterol biosynthesis in WT and Qk-/- differentiated oligodendrocytes. y-axis: normalized reads. (H) ChIP-qPCR results showing the recruitment of Srebp2 to the promoter regions of Hmgcs1 and Hmgcr in WT and Qk-/- differentiated oligodendrocytes. Data are shown as mean ± s.d. and were analyzed using Student’s t test. ***p<0.001; ****p<0.0001; ns: not significant.

