. 2021 Apr 26;10:e62639. doi: 10.7554/eLife.62639

Figure 3. Cluster analysis of V1R firing pattern at E12.5.

(A, insets) Cluster analysis of embryonic V1R firing pattern was performed using three parameters that describe the firing pattern during a 2 s suprathreshold depolarizing pulses: the mean of the half-amplitude event duration (mean ½Ad), the coefficient of variation of ½ Ad (CV ½Ad) allowing to quantify the action potential variation within a train (CV was set to 0 when the number of spikes evoked by a depolarizing pulse was ≤3) and the duration ratio ddr = Σ½ Ad/Pw, obtained by dividing the sum of ½ Ad by the pulse duration Pw, that indicates the total time spent in the depolarized state. For example, ddr = 1 when a plateau potential (PP) lasts as long as the depolarizing pulse. Conversely, its value is low when the depolarizing pulse evokes a single AP only. (A) Dendrogram for complete linkage hierarchical clustering of 164 embryonic V1R (N = 140) according to the values of log mean ½Ad, CV ½Ad, and log ddr. The colored matrix below the dendrogram shows the variations of these three parameters for all the cells in the clusters (colored trees) extracted from the dendrogram. (B) The number of clusters was determined by analyzing the distribution of silhouette width values (see Materials and methods). The box plots show the distribution of silhouette width values when the number of clusters k varies from 2 to 12. The mean silhouette width values (red diamond-shaped points) attained their maximum when the estimated cluster number was 5. (C) 3D plot showing cluster distribution of embryonic V1R according to log mean ½Ad, CV ½Ad, and log ddr. Each cluster corresponds to a particular firing pattern as illustrated in (D). V1R that cannot sustain repetitive firing of APs (1–3 AP/pulse only, gray, single spiking [SS]), V1R that can fire tonically (red, repetitive spiking [RS]), V1R with a firing pattern characterized by a mix of APs and relatively short PPs (dark purple, mixed event short PP [ME short PP]), V1R with a firing pattern characterized by a mix of APs and relatively long plateau potentials (light purple, mixed event long PP [ME long PP]), and V1R with evoked PPs only (blue, PP). The arrow in (C) indicates three misclassified V1R that could not sustain repetitive firing although they were assigned to the cluster of repetitively firing V1R (see text).

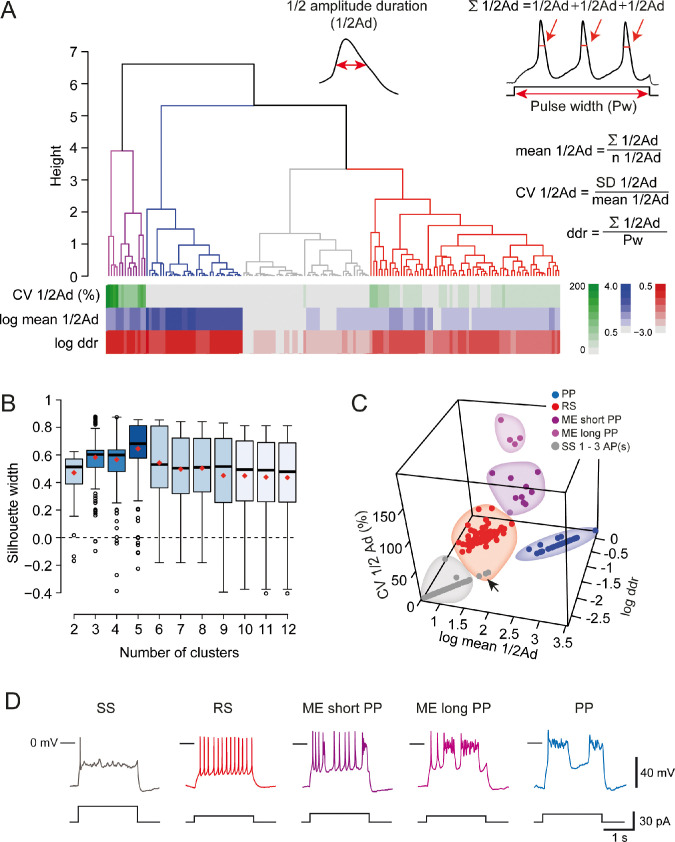
Figure 3—source data 1. Numerical data used to perform cluster analysis shown in Figure 3.

Figure 3.

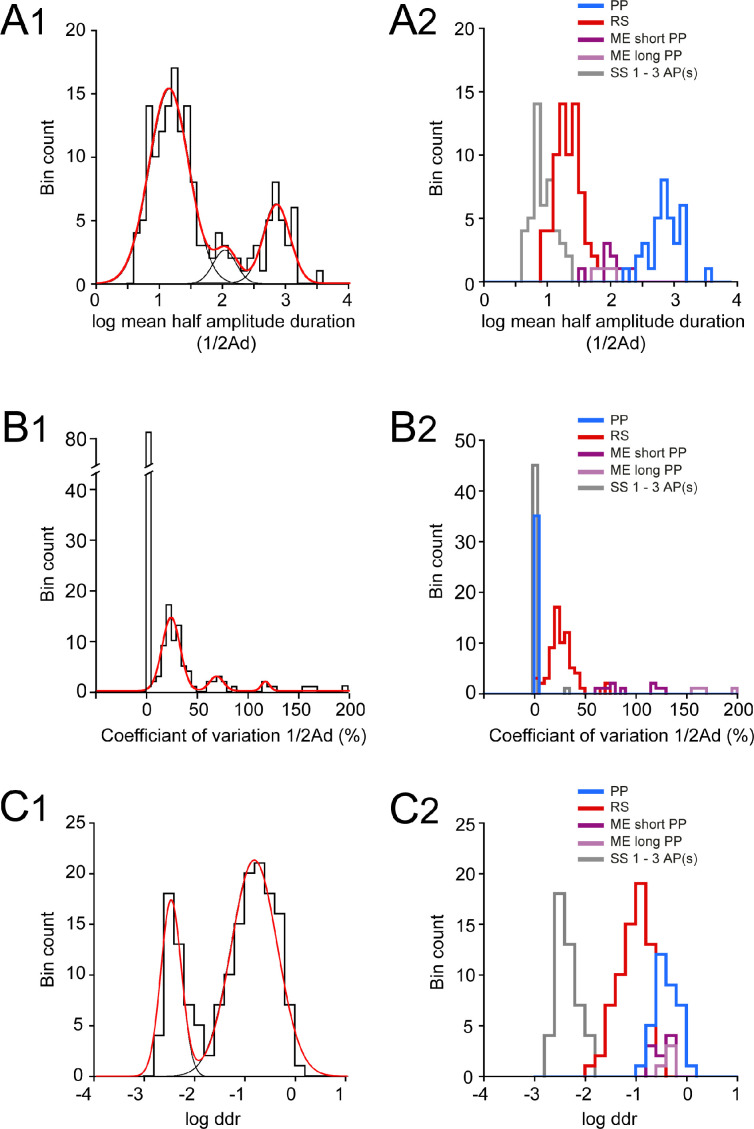
Figure 3—figure supplement 1. Distributions of log half-amplitude event duration (log ½Ad), coefficient of variation of ½ Ad (CV ½Ad), and log depolarizing duration ratio (log ddr) values related to the cluster analysis of embryonic V1R firing patterns.

Figure 3—figure supplement 1.

(A1) Histogram of log mean ½Ad for the whole V1R population at E12.5 (n = 164; bin width 0.1). The histogram was well fitted by the sum of three Gaussian curves with means and SDs of 1.135, 2.046, and 2.84, and 0.316, 0.181, and 0.21, respectively. (A2) Histogram of the values of log mean ½Ad sorted after cluster analysis showing single spiking (SS) V1R (gray), repetitive spiking (RS) V1R (red), mixed events (ME) V1R with short plateau potentials (ME short PP V1R, light purple), ME V1R with long plateau potentials (ME long PP V1R, dark purple), and PP V1R (blue). log mean ½Ad was significantly different between SS V1R, PP V1R, the whole ME V1R population (MEs and MEl V1R), and PP V1R (Kruskal–Wallis test p<0.0001; SS V1R versus RS V1R, p<0.0001; SS V1R versus ME V1R, p<0.0001; SS V1R versus PP V1R, p<0.0001; RS V1R versus ME V1R, p=0.0004; RS V1R versus PP V1R, p<0.0001; ME V1R versus PP V1R, p=0.018; SS V1n = 46, RS V1n = 69, MEs V1n = 9, MEl V1n = 4, PP V1n = 35). (B1) Histogram of CV ½Ad for the whole V1R population at E12.5 (n = 164; bin width 5%). Note that a large population of V1R had zero CV ½Ad (n = 83). The histogram for CV ½Ad ≠ 0 was fitted by the sum of three Gaussian curves with means and SDs of 23.4, 68.4, and 117 (%) and 8.9, 6.8, and 4.1, respectively. (B2) Histograms of the values of CV ½Ad sorted after cluster analysis showing SS V1R (black), RS V1R (red), MEs V1R (light purple), MEl V1R (dark purple), and PP V1R. CV ½Ad was not significantly different between SS V1R and PP V1R (CV ½Ad of SS V1R and PP V1R = 0.682% and 0%, respectively: only one of the 46 SS V1R displayed 3 PA and had a CV ½Ad of 31.37). CV ½Ad was significantly different between RS V1R and the whole ME V1R population and also between SS V1R or PP V1R and RS V1R or ME V1R (Kruskal–Wallis test p<0.0001; SS V1R versus RS V1R, p<0.0001; SS V1R versus ME V1R, p<0.0001; SS V1R versus PP V1R, p=0.846; RS V1R versus ME V1R, p=0.0003; RS V1R versus PP V1R, p<0.0001; ME V1R versus PP V1R, p<0.0001). (C1) Histogram of log ddr (sum of ½Ad divided by pulse duration) for the whole V1R population at E12.5 (n = 164; bin width 0.2). The histogram was fitted by the sum of two Gaussian curves with means and SDs of −2.51 and −0.851, and 0.2 and 0.46, respectively. (C2) Histograms of the values of log ddr sorted after cluster analysis showing SS V1R (black), RS V1R (red), MEs V1R (light purple), MEl V1R (dark purple), and PP V1R. log (ddr) was not significantly different between ME V1R and PP V1R, while it was significantly different between SS V1R and RS V1R, SS V1R and the whole ME V1R population, SS V1R and PP V1R, RS V1R and the whole ME V1R population, RS V1R and PP V1R (Kruskal–Wallis test p<0.0001; SS V1R versus RS V1R, p<0.0001; SS V1R versus ME V1R, p<0.0001; SS V1R versus PP V1R, p<0.0001; RS V1R versus ME V1R, p<0.0001; RS V1R versus PP V1R, p<0.0001; ME V1R versus PP V1R, p=0.977). MEs V1R and MEl V1R differed only by their CV ½Ad (Mann–Whitney test, log mean ½Ad for MEs V1R versus log mean ½Ad for MEl V1R, p=0.26; CV ½Ad for MEs V1R versus CV ½Ad MEl V1R, p=0.0028 and log ddr for MEs V1R versus log ddr for MEl V1R, p=0.1483). It is noteworthy that the distribution of the values of each metric was multimodal, thus indicating that each of them could partially discriminate different groups of embryonic V1R according to their firing pattern.