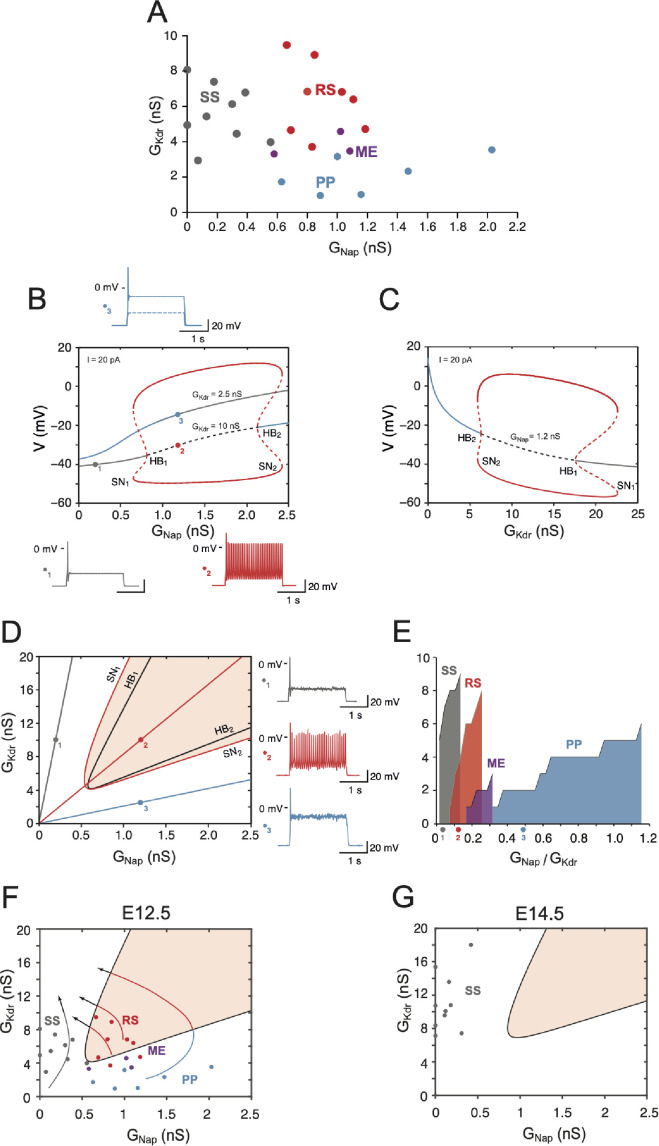
Figure 7. Embryonic V1R firing patterns predicted by computational modeling.
(A) Firing patterns of 26 recorded cells, in which both and were measured. Gray: single spiking (SS); red: repetitive spiking (RS); blue: plateau potential (PP). The three purple points located at the boundary between the RS and PP regions correspond to mixed events (ME), where plateau potentials alternate with spiking episodes. Note that no cell exhibited low values of both and (lower left) or large values of both conductances (upper right). (B) Bifurcation diagram of the deterministic model when is kept fixed to 2.5 nS or 10 nS while is varied between 0 and 2.5 nS. = 1 nS and = 20 pA. For = 10 nS (i.e., in the top experimental range), the red curves indicate the maximal and minimal voltages achieved on the stable limit cycle associated with repetitive firing (solid lines) and on the unstable limit cycle (dashed lines). The fixed point of the model is indicated by a gray solid line when it corresponds to the stable quiescent state, a gray dashed line when it is unstable, and a solid blue line when it corresponds to a stable plateau potential. The two Hopf bifurcations (HB) corresponding to the change of stability of the quiescence state (HB1, = 0.81 nS) and the voltage plateau (HB2, = 2.13 nS) are indicated, as well as the two saddle node (SN) bifurcations of limit cycles associated with the onset (SN1, 0.65 nS) and offset (SN2, = 2.42 nS) of repetitive spiking as is increased. For = 2.5 nS, the model does not display repetitive firing; it possesses a unique fixed point, which is always stable (blue-gray curve). The transition from quiescence to plateau is gradual with no intervening bifurcation. Representative voltage traces of the three different activity patterns are shown: SS in response to a 2 s current pulse (gray, = 0.2 nS, = 10 nS), RS (red, = 1.2 nS, = 10 nS), and PP (blue, = 1.2 nS, = 2.5 nS). Note that the plateau never outlasts the current pulse. (C) Bifurcation diagram when is kept fixed at 1.2 nS and is varied between 0 and 25 nS ( = 20 pA). Same conventions as in (B). PP is stable until the subcritical HB2 ( = 6.34 nS) is reached, repetitive firing can be observed between SN2 ( = 5.93 nS) and SN1 ( = 22.65 nS). The quiescent state is stable from point HB1 (= 17.59 nS) onward. (D) Two-parameter bifurcation diagram of the model in the - plane ( = 20 pA). The black curves indicate the bifurcations HB1 and HB2. The red curves indicate the SN bifurcations of limit cycles SN1 and SN2. The shaded area indicates the region where repetitive firing can occur. The oblique lines through the points labeled 1, 2, and 3, the same as in (B), correspond to three different values of the ratio of / : 0.02 (gray), 0.12 (red), and 0.48 (blue). Voltage traces on the right display the response to a 2 s current pulse when channel noise is taken into account for the three regimes: SS (top, gray trace and dot in the diagram), RS (middle, red), and PP (bottom, blue). They correspond to the three deterministic voltage traces shown in (B). Note that the one-parameter bifurcation diagrams shown in (B) correspond to horizontal lines through points 1 and 2 ( = 10 nS) and through point 3 ( = 2.5 nS), respectively. The bifurcation diagram in (C) corresponds to a vertical line through points 2 and 3 ( = 1.2 nS). (E) Cumulative distribution function of the ratio for the four clusters in (A), showing the sequencing SS (gray) → RS (red) → ME (purple, three cells only) → PP (blue) predicted by the two-parameter bifurcation diagram in (D). The wide PP range, as compared to SS and RS, merely comes from the fact that is small for cells in this cluster. The three colored points indicate the slopes of the oblique lines displayed in (D) . (F) The data points in (A) are superimposed on the two-parameter bifurcation diagram shown in (D), demonstrating a good agreement between our basic model and experimental data (same color code as in A for the different clusters). The bifurcation diagram is simplified compared to (A), only the region where repetitive spiking is possible (i.e., between the lines SN1 and SN2 in A) being displayed (shaded area). Notice that three ME cells (purple dots) are located close to the transition between the RS and PP regions. The four arrows indicate the presumable evolution of and for SS, RS, ME, and PP cells between E12.5 and E14.5–15.5. eventually decreases while keeps on increasing. (G) Distribution of a sample of cells in the - plane at E14.5. All the cells are located well within the SS region far from bifurcation lines because of the decreased compared to E12.5, the increased , and the shift of the RS region (shaded) due to capacitance increase (18 versus 13 pF).


