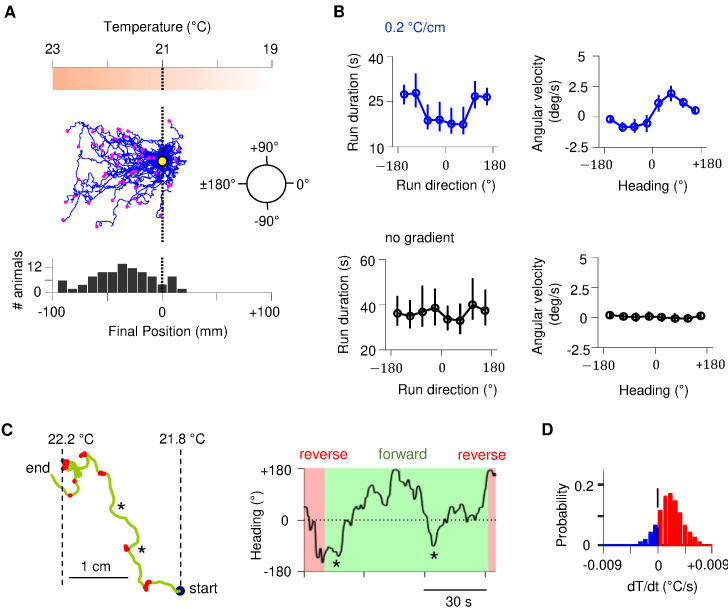
Figure 1. Sustained forward motor state despite temperature fluctuations during positive thermotaxis.
(A) Example trajectories of wild-type C. elegans cultivated at 25°C migrating up a linear temperature gradient over 20 min. Top: schematics of the thermal gradient. Middle: trajectories of 49 animals during positive thermotaxis. The starting points of all trajectories are aligned (yellow dot) and the end points are marked by magenta dots. Bottom: a histogram of the final location of animals. (B) Left column: duration of forward runs as a function of their overall direction (vector pointing from the starting point to the end point of the run). Right column: instantaneous velocity during forward runs as a function of the instantaneous heading angle. Top row: data from animals exposed to spatial thermal gradients (top, N = 140). Bottom row: data from animals under constant temperature surfaces (bottom, N = 73). (C) Thermotaxis trajectory of a single animal during thermotaxis with alternating periods of forward movement and reversals (left), and the instantaneous heading angle over time during one extended period of forward movement within the trajectory (right). Asterisks denote periods where the heading direction pointed down the thermal gradient. (D) Histogram of temporal changes in temperature () experienced by animals during forward runs that ended up pointing up the temperature gradient. Data from N = 140 wild-type animals exposed to linear thermal gradient and N = 73 wild-type animals exposed to constant temperature of 21°C. Error bars are standard errors of the mean (s.e.m.).


