. 2021 Apr 21;10:e68848. doi: 10.7554/eLife.68848

Figure 3. Motor-related activity in the AIY interneuron represents a corollary discharge signal.

(A, B) Calcium activity of the AIY interneuron aligned to the onset of forward runs (left column) or reversals (right column) in animals exposed to oscillating temperature (A, N = 6) or constant temperature (B, N = 5). Each row of the heat plots represents AIY calcium activity during a single behavioral epoch. The curve on top of each panel represents activity dynamics averaged across individual epochs. Broken lines indicate the onset and offset of each behavior epochs. (C) Calcium activity of the AIY interneuron aligned to the onset of forward runs or reversals in animals expressing tetanus toxin (TeTx) specifically in AIY (N = 4). (D) Calcium activity of AIY aligned to onset or offset of AVA activation in animals immobilized by the cholinergic agonist levamisole (N = 4). The ON and OFF states of AVA activity are defined by binarizing AVA activity using the Otsu method. See Materials and methods for details. (E) Change in AIY activity before versus. after the onset of forward runs (green) or reversals (red) for datasets shown in (A) and (B). Wilcoxon Signed rank test was used to test if the change in AIY activity has a median significantly different from zero, *p<0.05; **p<0.01; ***p<0.001; n.s., non-significant.

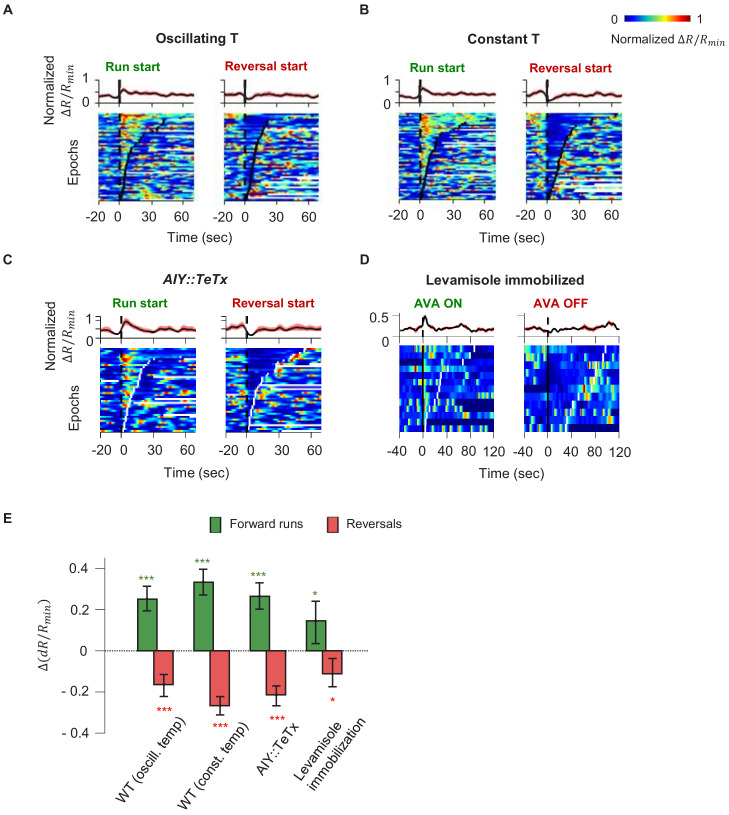
Figure 3—source data 1. AIY activity analysis - wild type.

Figure 3.

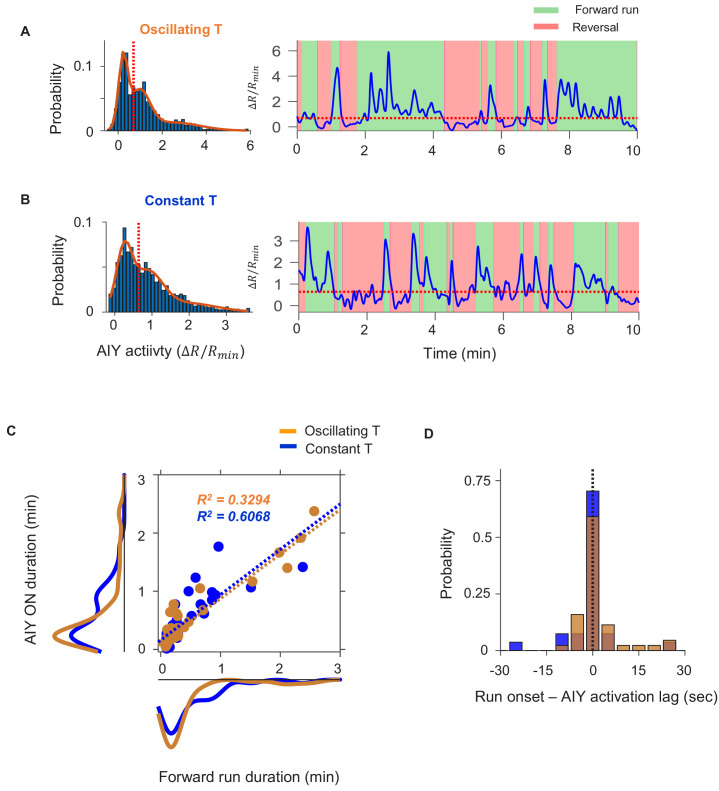
Figure 3—figure supplement 1. Quantification of persistent activity in AIY in wild-type animals.

Figure 3—figure supplement 1.

(A, B) Definition of the AIY ON state. (A) Example histogram (left) and time-series trace (right) of AIY activity under oscillating temperature. Solid curve is derived by fitting the distribution with a Gaussian mixture model with three components. Dotted orange lines in both plots indicate the local minimum between the centers of the first two components of the Gaussian mixture model. Activity above the dotted orange line is classified as the ON state. (B) Same analyses as in (A) on a sample AIY activity trace measured under constant temperature. Activity above the dotted orange line is classified as the ON state. (C) The duration of the forward run state exhibits positive correlation with the duration of the AIY ON state under both oscillating and constant temperature. (D) Time lag between the onset of AIY ON states and the onset of forward runs for data collected under oscillating (orange) or constant (blue) temperatures. Positive values indicate that the AIY ON state followed the onset of the forward run.
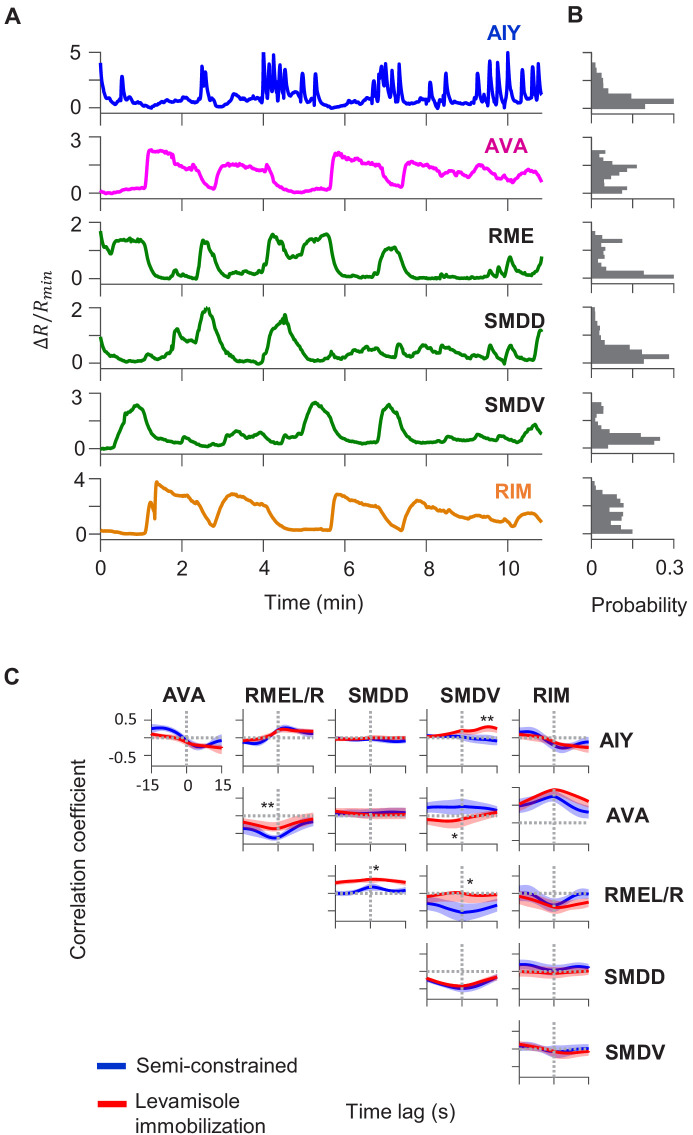
Figure 3—figure supplement 2. Circuit-level neural activity in immobilized animals.

Figure 3—figure supplement 2.

(A) Simultaneously measured calcium activity in AIY and neurons of the motor circuit in an animal pharmacologically immobilized by levamisole. (B) Cross-correlation functions between the activity of AIY and that of simultaneously measured interneurons and motor neurons. (C) Average pairwise cross-correlation functions among neurons in wild-type animals under semi-constrained (blue) and pharmacologically immobilized (red) preparations. Data are from N = 4 wild-type animals. Error bars are standard errors of the mean (s.e.m.). Wilcoxon rank-sum test was used to compare the peak mean cross-correlation values between data under oscillating temperature versus data under constant temperature. *p<0.05; **p<0.01; ***p<0.001; no asterisk p>0.05.