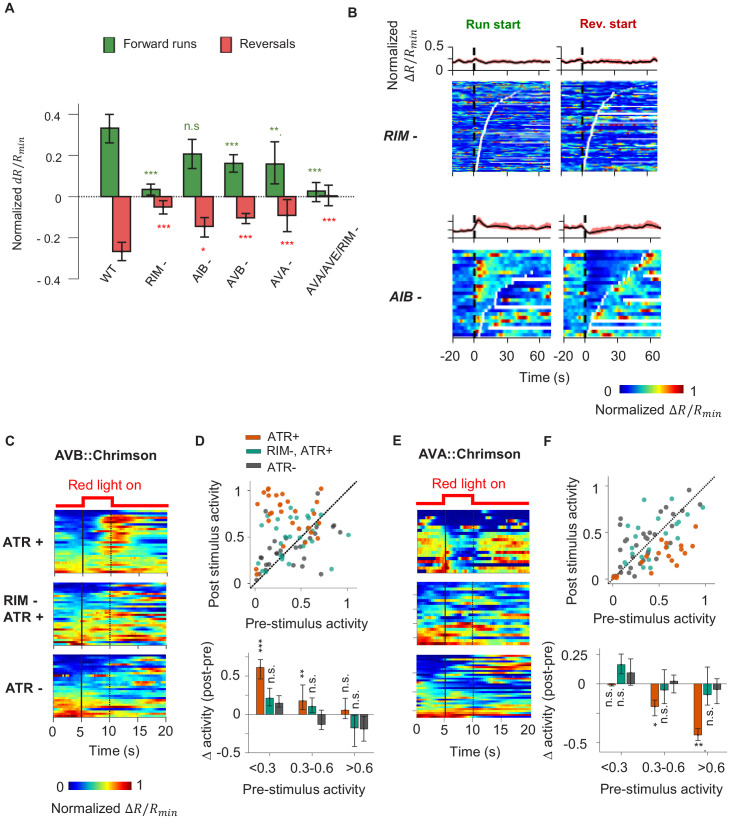
Figure 4. A corollary discharge (CD) pathway that requires the RIM interneuron couples AIY activity with the motor state.
(A) Change in AIY activity before versus. after the onset of forward runs (green) or reversals (red) in animals where candidate neurons for relaying the CD signal have been ablated. Data are from RIM-ablated animals (N = 9); AIB-ablated animals (N = 3); AVB-ablated animals (N = 4); AVA-ablated animals (N = 4); and AVA/AVE/RIM (nmr-1::miniSOG)-ablated animals (N = 4). Error bars are 95% CI. Wilcoxon rank-sum test was used to test if the distributions of AIY activity before and after the onset of motor states have the same median: *p<0.05; **p<0.01; ***p<0.001; no asterisk p>0.05. (B) AIY activity aligned to the onset of forward runs (left column) or reversals (right column) in the animals where neurons RIM (upper panels, N = 9) or AIB (lower panels, N = 3) have been genetically ablated. (C) AIY activity in response to optogenetic stimulation of the AVB premotor interneurons in wild-type animals grown on all-trans retinal (ATR) (top, N = 5), RIM-ablated animals grown on ATR (N = 6), and wild-type animals grown without ATR (N = 3). (D) Top: AIY activity 2.5 s before (pre-stimulus) versus 2.5 s at the end of the AVB opto-stimulation (post-stimulus) under experimental conditions shown in (D). Bottom: average change in AIY activity pre-and post-stimulation under experimental conditions shown (D). Trials are sorted into three groups based on pre-stimulation AIY activity. Same datasets as in (C). (E) AIY activity in response to optogenetic stimulation of the AVA premotor interneurons in wild-type animals grown on ATR (top, N = 4), RIM-ablated animals grown on ATR (middle, N = 5), and wild-type animals grown without ATR (bottom, N = 5). (F) Top: AIY activity 2.5 s before (pre-stimulus) versus 2.5 s at the end of the AVA opto-stimulation (post-stimulus) under experimental conditions shown in (E). Bottom: average change in AIY activity pre- and post-stimulation under experimental conditions shown in (E). Trials are sorted into three groups based on pre-stimulation AIY activity. Same datasets as in (E). For (E) and (F), error bars are 95% CI; Wilcoxon signed-rank test was used to test if the average post-stimulation change in AIY activity was significantly different from 0. *p<0.05; **p<0.01; ***p<0.001; no asterisk p>0.05.


