. 2021 Apr 21;10:e68848. doi: 10.7554/eLife.68848

Figure 5. Characterization of circuit-level neural activity in behaving RIM-ablated animals under fluctuating or constant temperature.

(A) Simultaneously measured activity of AIY and neurons of the motor circuit in RIM-ablated animals under oscillating temperature. Middle panels show histograms of neuron activity during forward runs (green) or reversals (red) for the dataset to the left. Right panels show average cross-correlograms between neural activity and thermal stimuli during forward runs and reversals across RIM-ablated animals (N = 3). Error bars are 95% CI of the mean. Wilcoxon rank-sum test was used to compare the peak mean cross-correlation values during forward runs (green) versus reversals (red). *p<0.05; **p<0.01; ***p<0.001; no asterisk p>0.05. (B) Thermal stimulus-triggered activity of the AIY interneuron during forward runs (left column) and reversals (right column) in RIM-ablated animals (N = 3). Individual stimulus epochs from the same neuron under the given motor state were concatenated into heat maps, with the average activity trace shown on top. (C) Simultaneously measured activity of AIY and neurons of the motor circuit in RIM-ablated animals under constant temperature (left). Right panels show histograms of neuron activity during forward runs (green) or reversals (red). (D) Violin plots showing the distribution of changes in AIY activity in response to warming (left) or cooling (right) stimuli under forward run or reversal state in wild-type and RIM-ablated animals. Dotted black lines indicate threshold values used to calculate the response probability in (E). (E) Probability that the magnitude of change in AIY activity upon warming or cooling is above defined thresholds in wild-type or RIM-ablated animals. See Materials and methods for details. For (D) and (E), N = 5 wild-type animals and N = 3 RIM-ablated animals. Error bars are 95% CI of the mean. Wilcoxon rank-sum test *p<0.05; **p<0.01; ***p<0.001; n.s., non-significant.

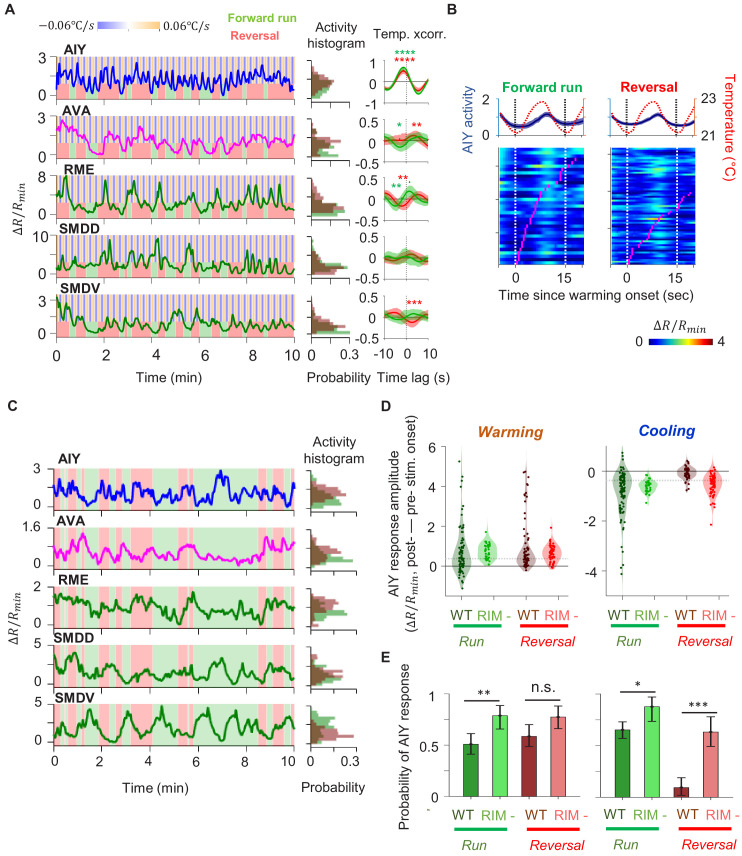
Figure 5—source data 1. Circuit activity under thermoal stimulation in RIM ablated animals.

Figure 5.

Figure 5—figure supplement 1. Analysis of AIY activity in RIM-ablated animals.

Figure 5—figure supplement 1.

(A) Top: example histogram (left) and time-series trace (right) of AIY activity under oscillating temperature. Solid curve is derived by fitting the distribution with a Gaussian mixture model with three components. Dotted orange lines in both plots indicate the local minimum between the centers of the first two components of the Gaussian mixture model. Activity above the dotted orange line is classified as the ON state. See Materials and methods for details. Bottom: same analyses as in (A) on a sample AIY activity trace measured under constant temperature. Activity above the dotted orange line is classified as the ON state. (B) Violin plot showing the distributions of the duration of AIY ON states in wild-type versus RIM-ablated animals under oscillating and constant temperature. Data are from: N = 5 wild-type animals under oscillating temperature, N = 6 wild-type animals under constant temperature, N = 3 RIM-ablated animals under oscillating temperature, and N = 4 RIM-ablated animals under constant temperature. Wilcoxon rank-sum test *p<0.05; **p<0.01; ***p<0.001; n.s., non-significant.
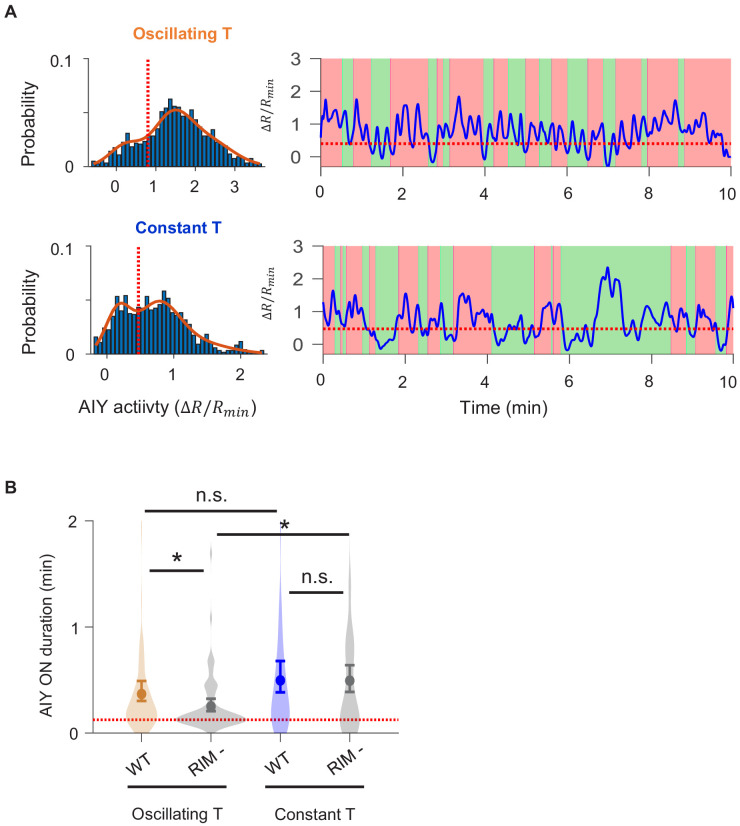
Figure 5—video 1. Circuit-wide neural activity in semi-constrained RIM-ablated animal exposed to oscillating temperature.
Download video file (4.2MB, mp4)
Left: calcium imaging of GCaMP6s (green) and wCherry (red) signals in head neurons involved in thermosensory processing or locomotory control. Neuron names are listed next to the neurite (AIY only) or soma (all other neurons) regions from which fluorescent signals are extracted. Video is sped up five times. Right: ratiometric calcium activity traces extracted from the video to the left. Background colors indicate the oscillating thermal stimuli (blue-orange) and the forward run (green) and reversal (red) states of the animal. Same dataset as in Figure 5A.