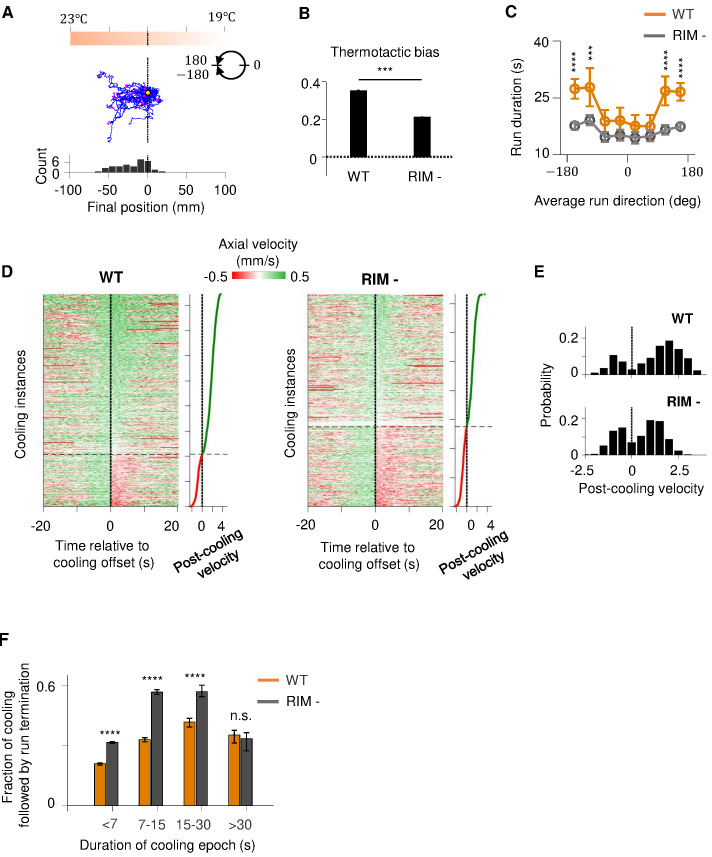
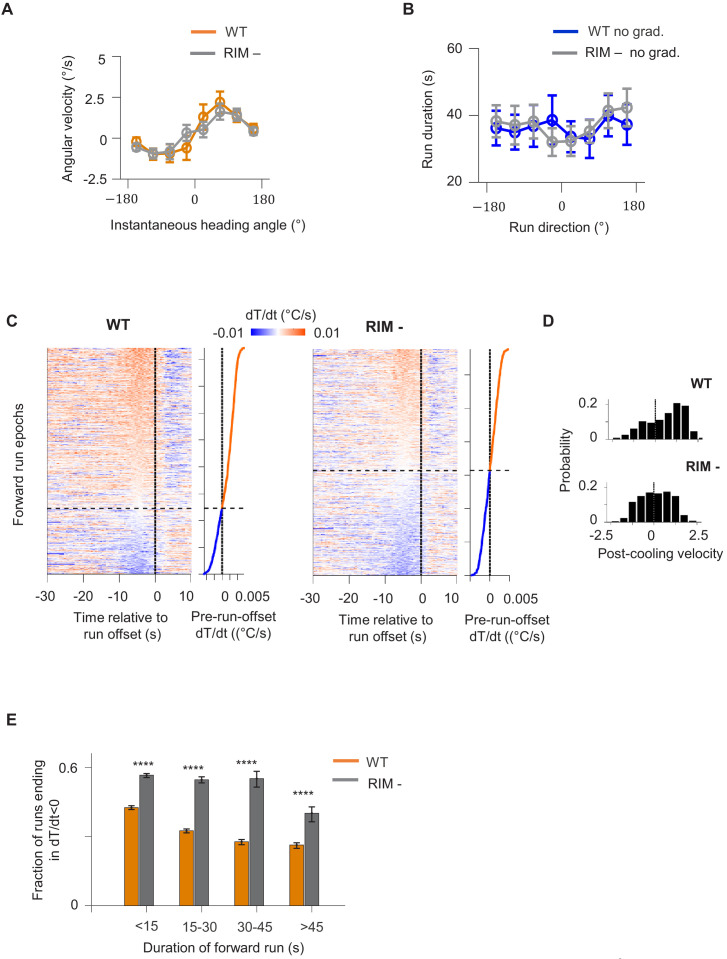
Figure 6. RIM ablation disrupts positive thermotaxis and leads to increased susceptibility to sensory fluctuations.
(A) Example trajectories of RIM-ablated animals (N = 39) cultivated at 25°C and exposed to the same thermal gradient as in Figure 1A. Top: schematic of the thermal gradient. Middle: trajectories of individual animals during positive thermotaxis. The starting points of all trajectories are aligned (yellow dot) and the end points are marked by magenta dots. Bottom: a histogram of the final location of the animals at the end of the 20 min period. (B) Average thermotactic bias of wild-type (N = 140) versus RIM-ablated animals (N = 102). (C) Forward run duration as a function of forward run direction in RIM-ablated animals (blue) compared to the wild type (gray). Error bars are standard errors of the mean (s.e.m.). Wilcoxon rank-sum test was used to compare the run duration of wild-type versus RIM-ablated animals. p<*0.05, **0.01, ***0.001, p>0.05 (non-significant) for panels without asterisk. (D) Velocity profiles of wild-type (left) and RIM-ablated (right) animals aligned to the end of cooling epochs that occurred during forward runs. Heat maps are generated by concatenating velocity profiles from individual cooling epochs along the y-axis and sorting by the average velocity within the first 2 s after the offset of cooling epochs (shown as line plot to the right). Black dotted lines divide instances in which forward runs continued past the offset of cooling epochs from instances where reversals ensued within the first 2 min of cooling offset. (E) Histograms of post-cooling velocities in wild-type (top) and RIM-ablated animals (bottom). Analysis applied to same dataset as in (D). (F) Fraction of cooling epochs that were followed by transition from forward runs to reversals as a function of the duration of cooling epochs (orange: wild type, gray: RIM ablated).


