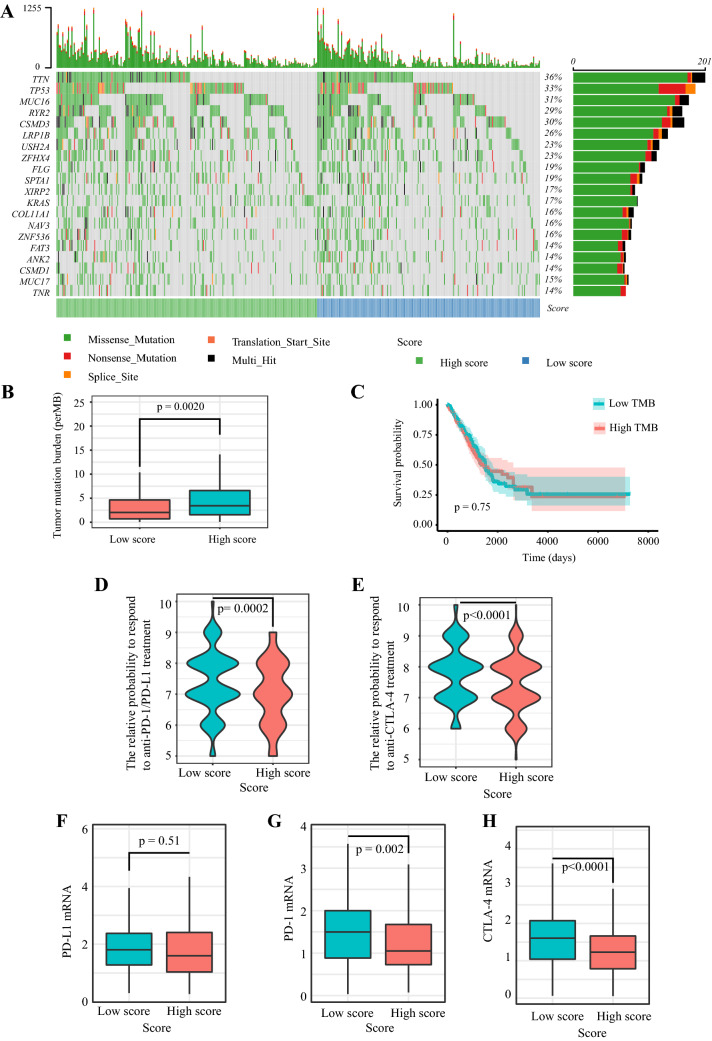
Fig. 8.
The mutation profile, TMB, relative probabilities to respond to immune checkpoint inhibitors, and the levels of immune checkpoint molecules in low-risk and high-risk groups. a Mutation profile of LUAD patients in low-risk and high-risk groups. b The difference of tumor mutation burden between low-risk and high-risk groups. c The association of tumor mutation burden and patients’ overall survival. d–e The relative probabilities to respond to anti-PD-1/PD-L1 and anti-CTLA-4 treatment in the low-risk score and high-risk score group. The expressions of (f) PD-L1, (j) PD-1, and (h) CTLA-4 in low-risk and high-risk groups

