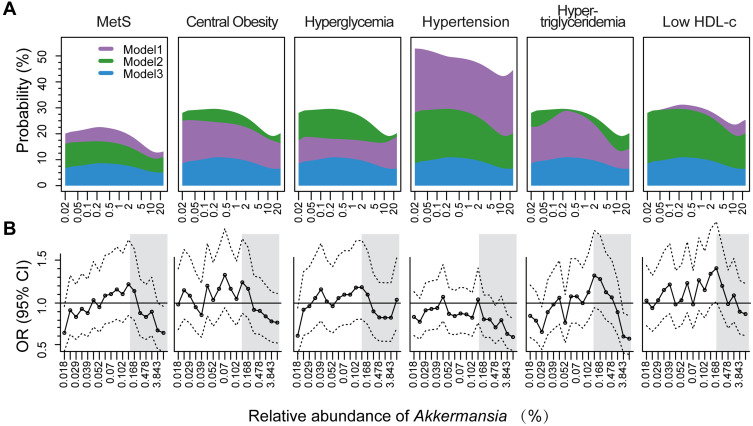
Figure 2.
Dose–response effect of Akkermansia on MetS and its components. (A) Association between risk of MetS and relative abundance of Akkermansia. Dose–response curves of Akkermansia were fitted to logistic models with cubic splines. Four knots at the 5th, 25th, 75th, and 95th percentiles were used in models. Model 1 was a crude regression without adjusting for confounders; model 2 was adjusted for age and sex; and model 3 was further adjusted for Bristol stool scale, geographic location, and annual income. A trend test of ORs across quintiles (Q1–Q5) was conducted by entering the median value of each quintile of Akkermansia abundance into the models. (B) ORs and 95% CIs across 20 percentiles of Akkermansia (with the first quintile [Q1] as a reference) in crude logistic models.

