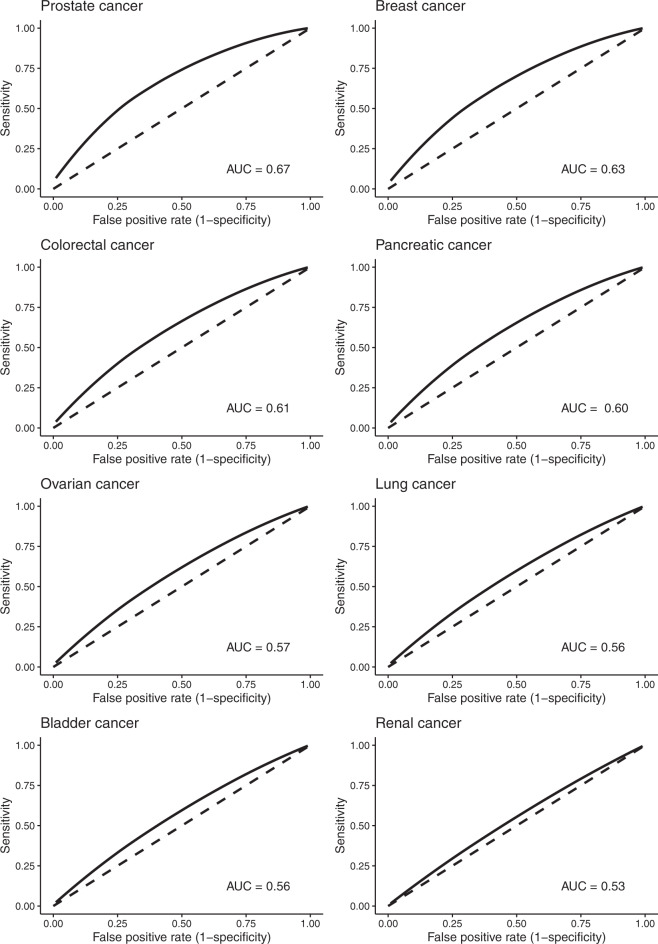
Fig. 2. Receiver operator plots of polygenic risk scores for eight common cancers.
AUC area under the curve. The AUC provides an estimate of the probability a randomly selected subject with the condition has a test result indicating greater than that of a randomly chosen individual without the cancer. The solid line represents a receiver operator curve based on polygenic risk score from known risk SNPs based on reference13. An AUC of 0.5 (dashed line) indicates that the classifier does not provide any useful information in discriminating cases from controls.

