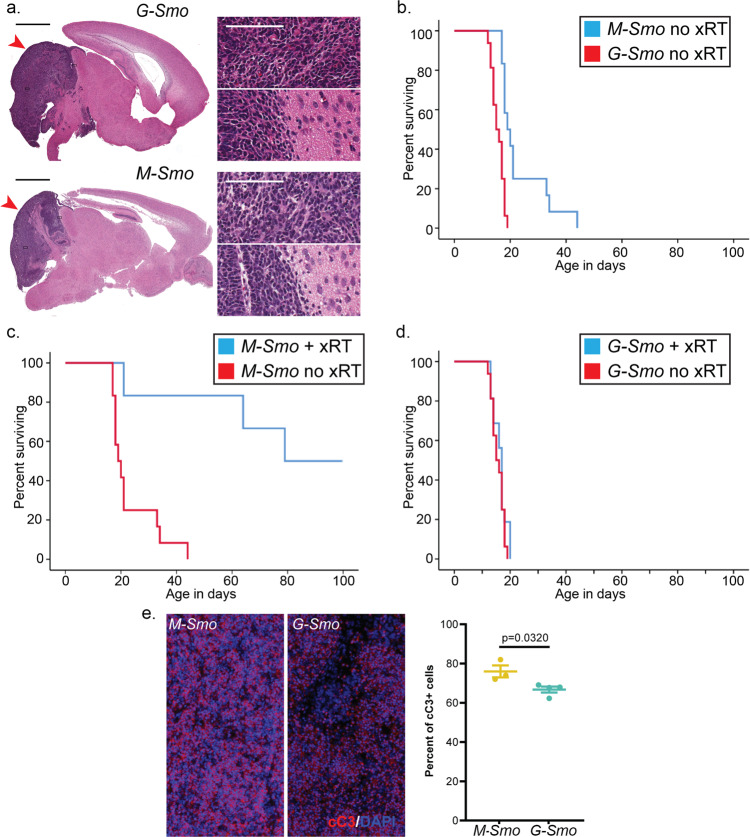
Fig. 1. M-Smo and G-Smo tumors show similar histology but different rates of progression and responses to treatment.
a Representative sagittal H&E-stained sections of each genotype at P15, with tumors highlighted by red arrowheads. Insets show regions within the tumors and regions at the tumor interface with the adjacent brain. Scale bars = 2 mm, or 100 µm in insets. b–d Kaplan–Meier curves comparing b survival of untreated mice of each genotype, c survival of M-Smo mice with and without xRT, and d survival of G-Smo mice with and without xRT. e Representative images of cC3 IHCin the indicated genotypes, 3 hours after xRT, and quantification of replicates. Scale bars = 25 µm. Log-rank test was used to compare survival times in b–d and Student’s t-test was used in e. Dots represent values for individual replicates, bars indicate the means, and whiskers indicate the SEM.

