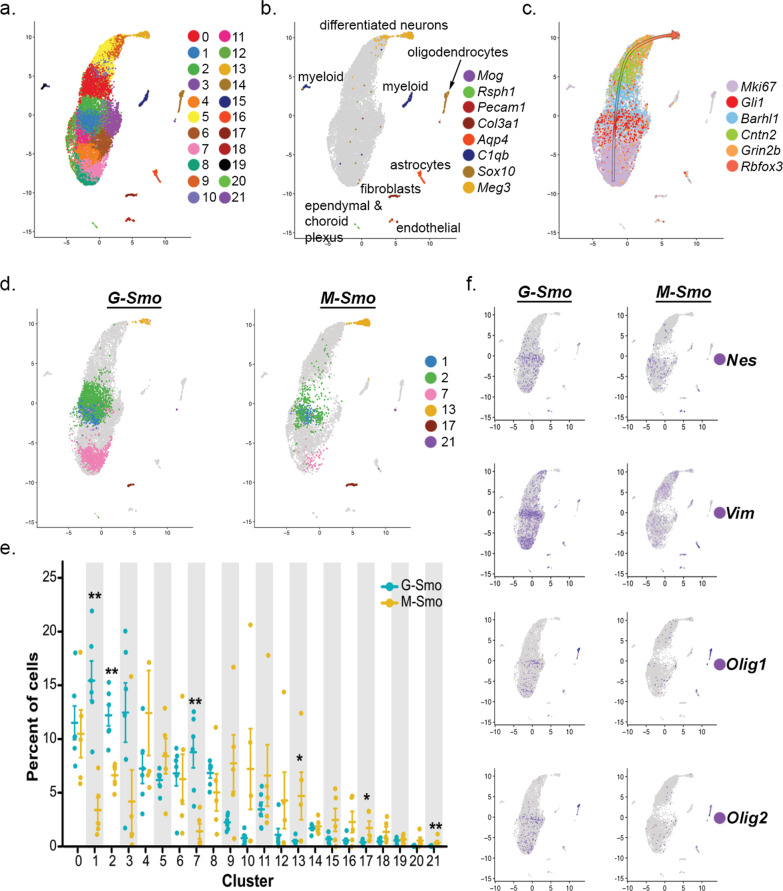
Fig. 2. Similarities and differences in the sub-populations of G-Smo and M-Smo tumors.
a UMAP plot of all cells from G-Smo and M-Smo tumors, color-coded by cluster. Cells are localized according to their proximity in PCA space. b, c Feature plots showing expression of b stromal markers, or c cerebellar granule neuron differentiation markers, color-coded over the UMAP shown in a arrow in c indicates the direction of differentiation across the UMAP. d UMAP plots deconvoluted by genotype, with differentially represented clusters color-coded. e Comparison of each cluster population in G-Smo and M-Smo tumors. Dots represent values for individual replicates, bars indicate the means and whiskers indicate the SEM. ** indicates p < 0.01, * indicates p < 0.05; Student’s t-test was used to make the pairwise comparison. f UMAP plots for each genotype, showing expression of the indicated stem cell markers.

