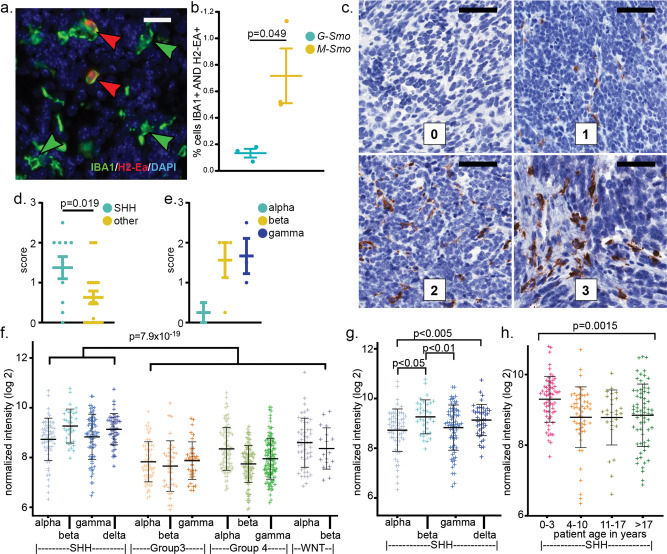
Fig. 7. Differential MHCII/HLA expression in G-Smo versus M-Smo tumors and in human medulloblastoma subsets.
a IHC for IBA1 and H2-Ea in a representative M-Smo tumor. b Quantification of the fraction of IBA1+/H2-Ea+ cells G-Smo and M-Smo tumors. c Representative IHC in human medulloblastomas using a pan-HLA-DR antibody, with scores as noted. d, e Quantification of the HLA-DR scores of human medulloblastomas for the indicated tumor types. f–h Analysis of HLA-DRA mRNA in published human medulloblastomas microarray data, comparing f SHH-subgroup versus all other subgroups, g SHH-alpha versus each other SHH subtype, or h SHH-subgroup stratified by age. Scale bars = 20 µm in a and 50 µm in c. Student’s test was used in b, d, e and one-way ANOVA was used in f–h. In all graphs, points represent values for individual replicates, bars indicate the means and whiskers indicate the SEM.

